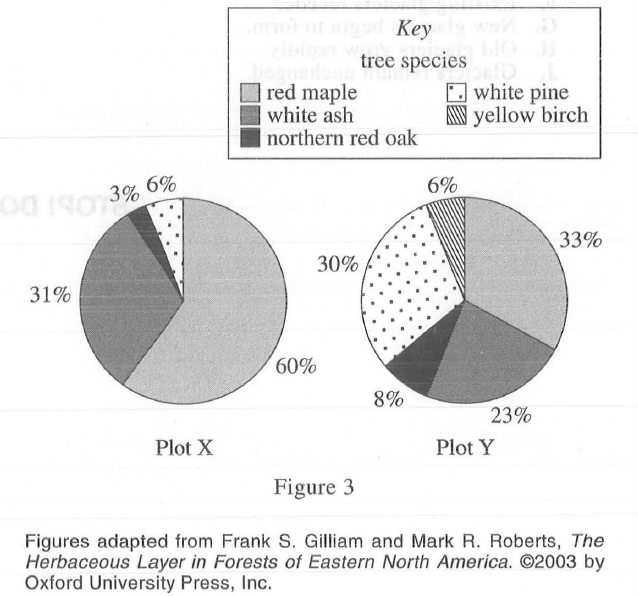
2. According to Figure 3, 1 yr after emergence, the greatest percent of the seedlings were from which of the tree species in Plot X and Plot Y, respectively?
Answer and Explanation
Your Answer is
Correct Answer is F
Explanation
Looking directly at figure 3, red maple accounts for the largest proportion on plot X and plot Y, which are 60% and 33% respectively