 ) for 8 isotopes of different elements.
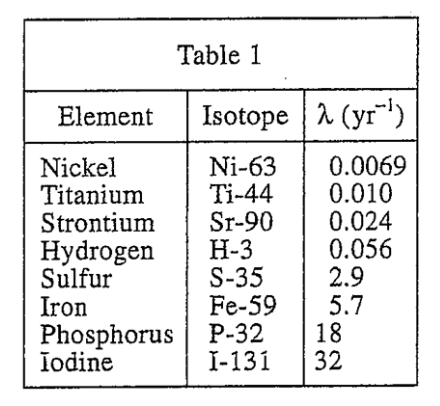
 , in a sample initially containing 1,000 of the nuclei.
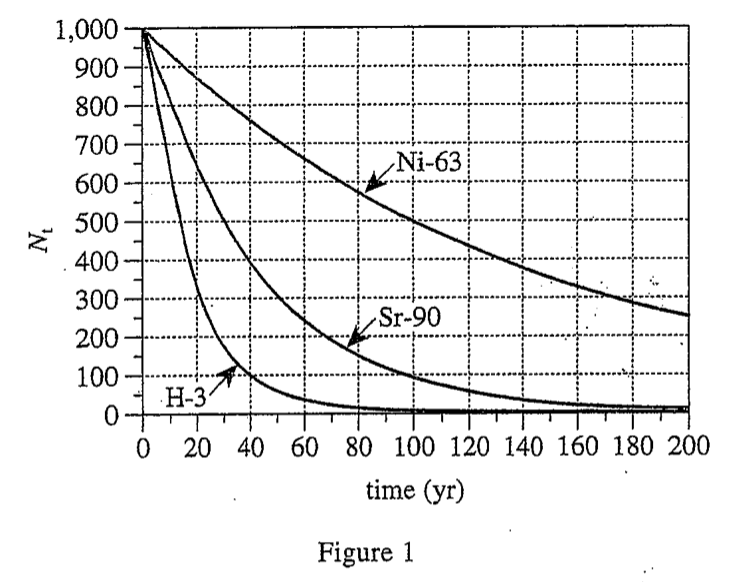
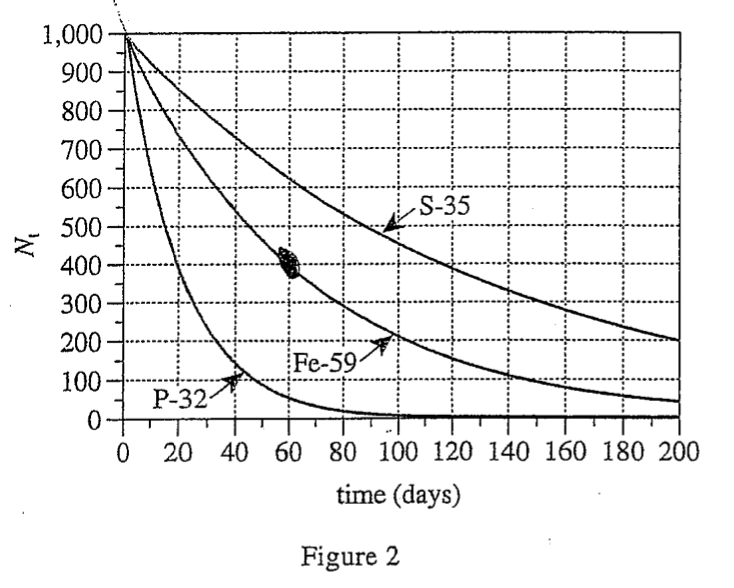
7. The data in Figure 2 for time = 140 days are best shown by which of the following graphs?
Answer and Explanation
Your Answer is
Correct Answer is D
Explanation
Look at figure 2, when the abscissa is 140, the ordinate Nt of P-32 is 0, Fe-59 is about 100, and S-35 is about 340, so the D option is consistent