Answer and Explanation
Your Answer is
Correct Answer is F
Explanation

50. The graph below illustrates the normal distribution curve. The percent of the data that falls within each standard deviation from the mean is given to the nearest 0.1%.
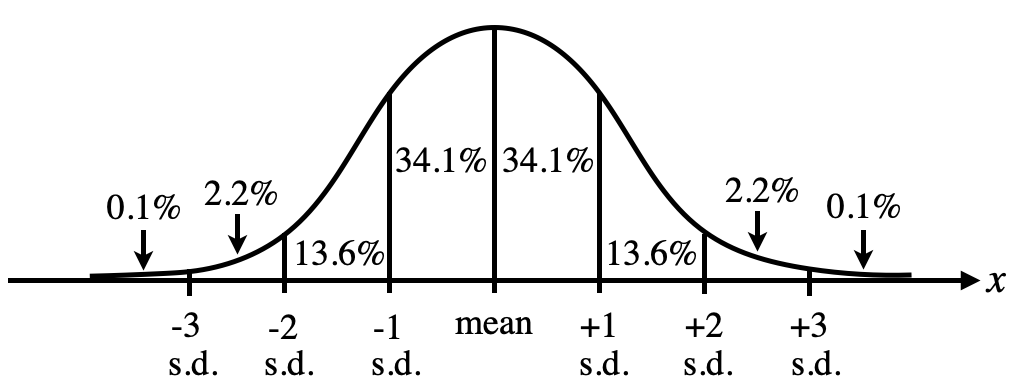
Suppose that the heights of men in a certain population are normally distributed with a mean of 69.0 inches and a standard deviation of 2.7 inches. To the nearest 0.1%, what percent of men in the population are at least 74.4 inches tall?
Your Answer is
Correct Answer is F
Explanation