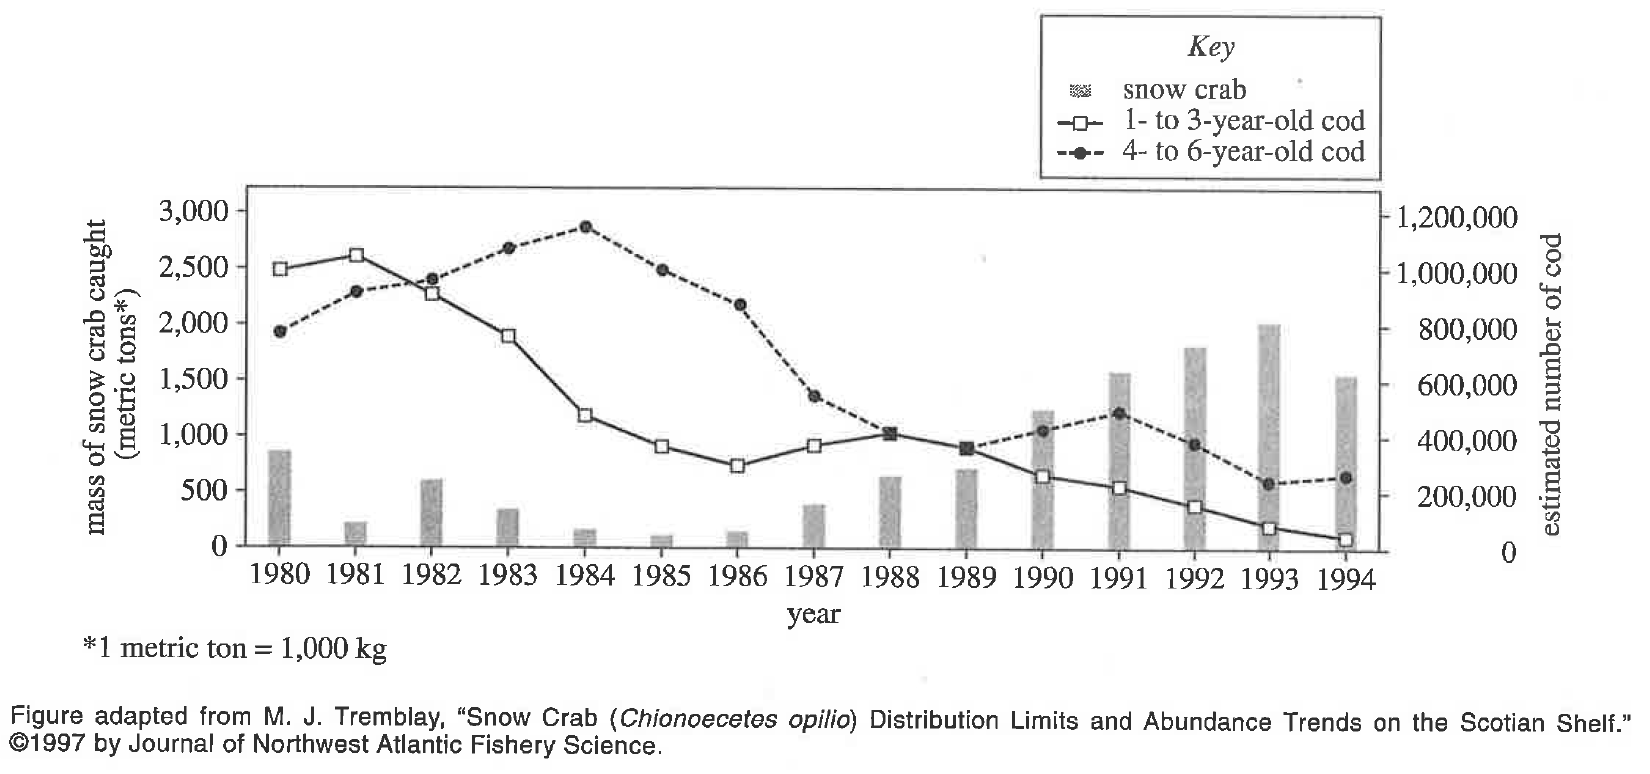
4. Consider the statement “When the total estimated number of cod (including both 1- to 3-year-old cod and 4- to 6-year-old cod) was relatively high, the mass of snow crab caught was relatively low.” Are the data in the figure for 1984 through 1986 and for 1992 through 1994 consistent with this statement?
Answer and Explanation
Your Answer is
Correct Answer is F
Explanation
First of all, in the figure, we can see that the curve representing cod in 1984-1986 is relatively high, indicating that the total number of cod in these years is relatively large, and the total number of cod in 1992 to 1994 is relatively small;
< p>Secondly, I saw that the histogram representing snow crab from 1984 to 1986 was relatively short, and on the contrary, the histogram from 1992 to 1994 was relatively high, so judging from the figure, the statement in the title is basically correct