20. Consider the graph shown below of pressure versus temperature for a gas in a closed container of fixed volume:
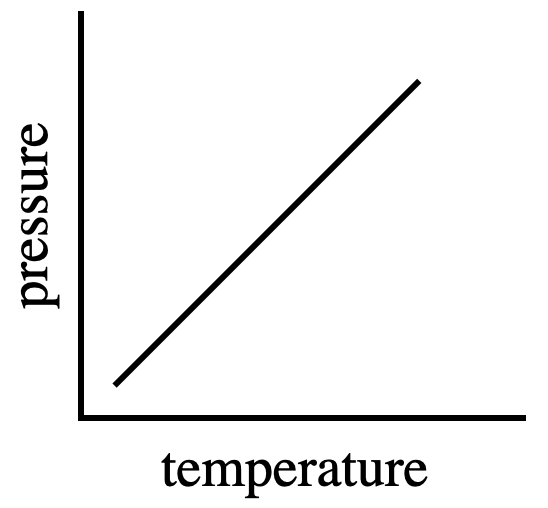
This graph is consistent with the model(s) provided by which of the scientists?
Answer and Explanation
Your Answer is
Correct Answer is H
Explanation
The graph in the title shows that as the temperature increases, the pressure also increases. The second paragraph of Scientist 1 and the second paragraph of Scientist 3 both expressed the same point of view, but Scientist 4 did not refute this point, which means that Scientist 4 also agrees. Only Scientist 2 mentioned in the second sentence that an increase in temperature will cause gas lattice to push less hard, which means that the pressure will decrease, so Scientist 2 can be excluded