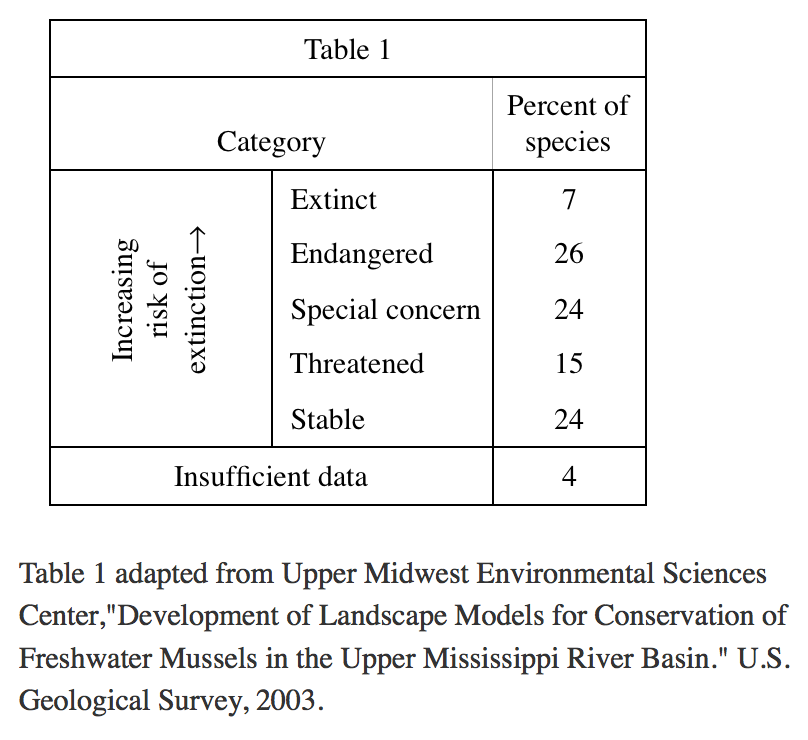
3. Based on Table 1, what percent of the pearly mussel species native to North America were the scientists able to place in a risk category but did not classify as extinct or stable?
Your Answer is
Correct Answer is D
Explanation
Looking at table 1, the three groups of data that are not extinct or stable and belong to risk category should be endangered, special concern, and threatened, so the total ratio should be 26%+24%+15%=65%

