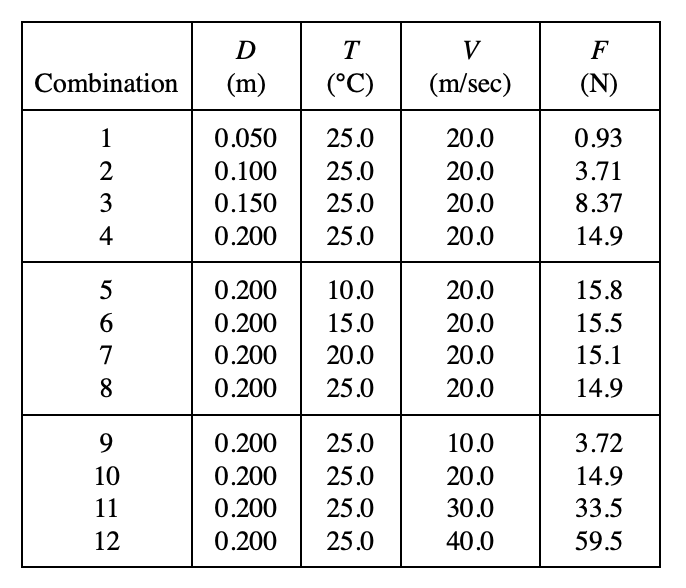
7. Based on Combinations 9-12, the relationship between F and V is best represented by which of the following graphs?
Answer and Explanation
Your Answer is
Correct Answer is C
Explanation
Looking at combinations 9-12 in the table, as V increases, F also increases, so exclude A & B;
From the increase of F, it can be seen that V and F are not proportional, So exclude D