11. The conductivity of the reaction solution at the end of a reaction is . Which of the following graphs best shows how
varied with acetone concentration?
Your Answer is
Correct Answer is C
Explanation
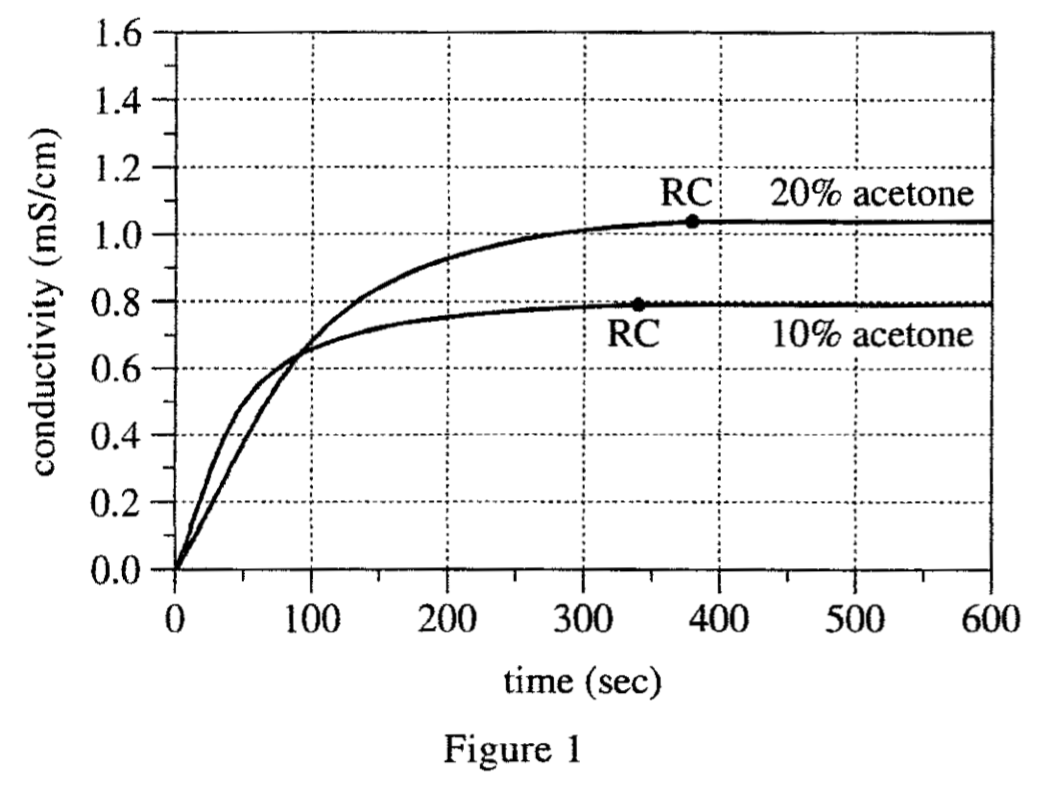
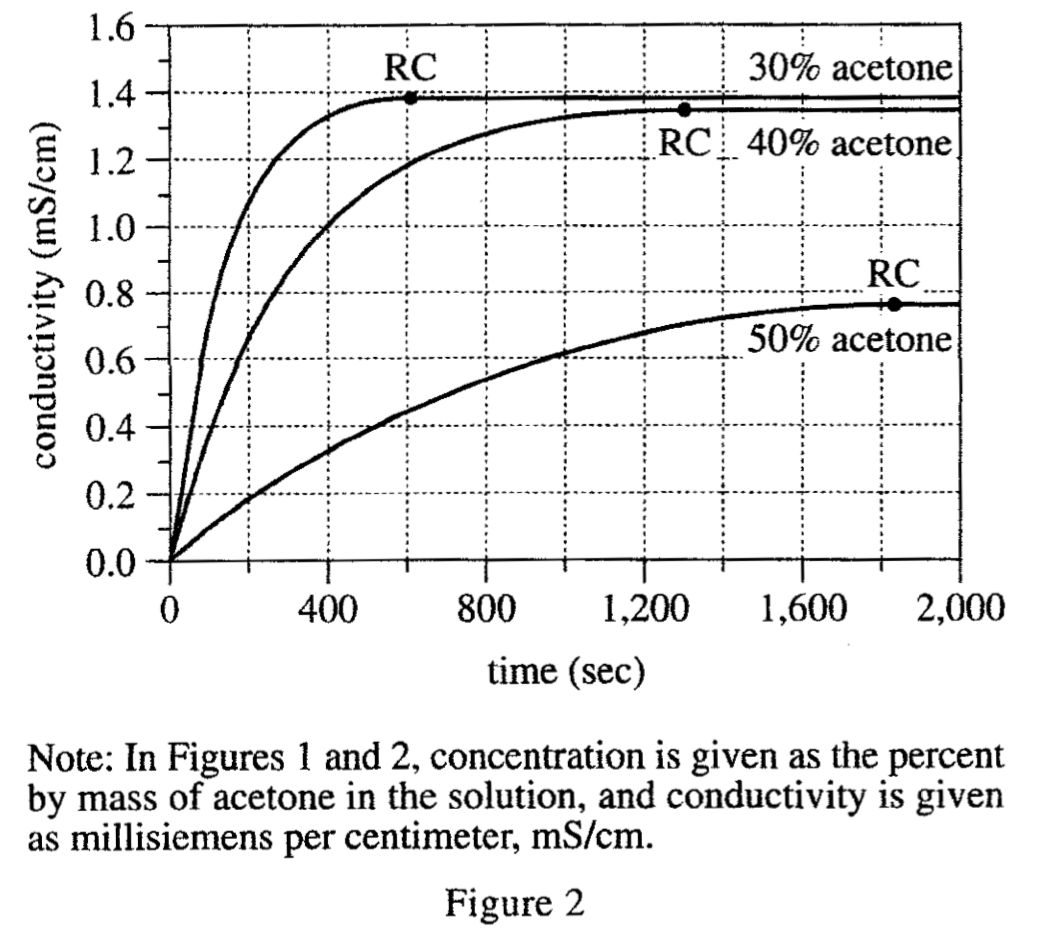
According to figure 1 & figure 2, in descending order, it can be seen that:
When the concentration of acetone is 30%, the conductivity will eventually reach about 1.4;
When the concentration is 40%, the conductivity is about 1.35;
When the concentration is 20%, the conductivity is 1.05; when the concentration is 10%, the conductivity is about 0.8;
When the concentration is 50%, Conductivity is the smallest, less than 0.8


