Answer and Explanation
Your Answer is
Correct Answer is D
Explanation
(6+15+20+30)÷4=17.75. Choose D.
Use the following information to answer questions 18-20.
The graph below shows the number of ski boats sold each month by Martin’s Marine Supply. The number near each point is the actual number of ski boats sold for the month corresponding with the point. The curve represents a model equation that comes close to fitting the actual numbers sold by month.
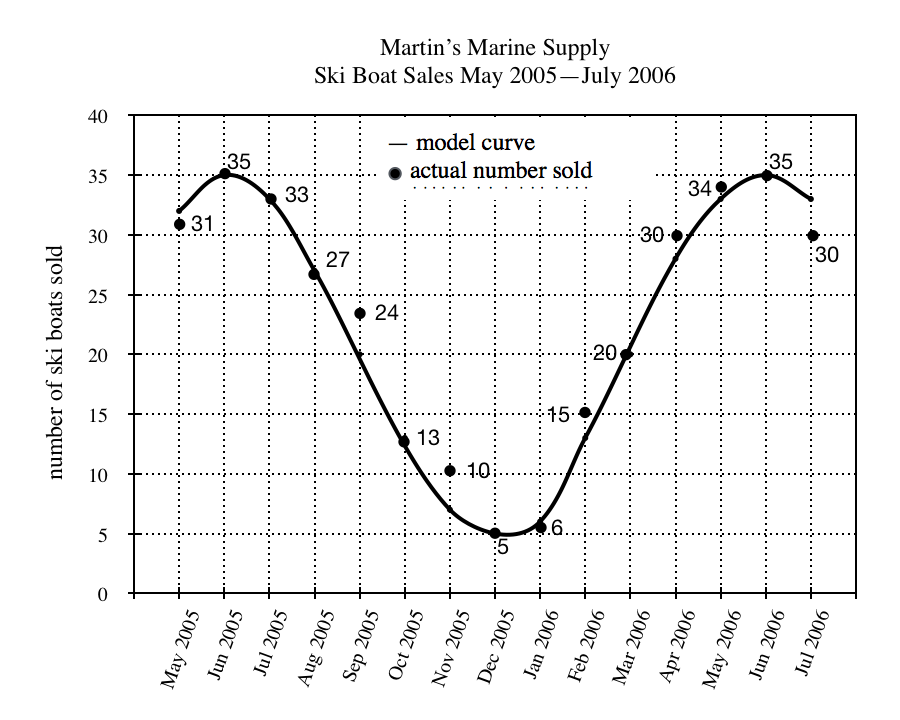
19. What is the average number of ski boats actually sold per month between and including the months of January 2006 and April 2006 ?
Your Answer is
Correct Answer is D
Explanation
(6+15+20+30)÷4=17.75. Choose D.