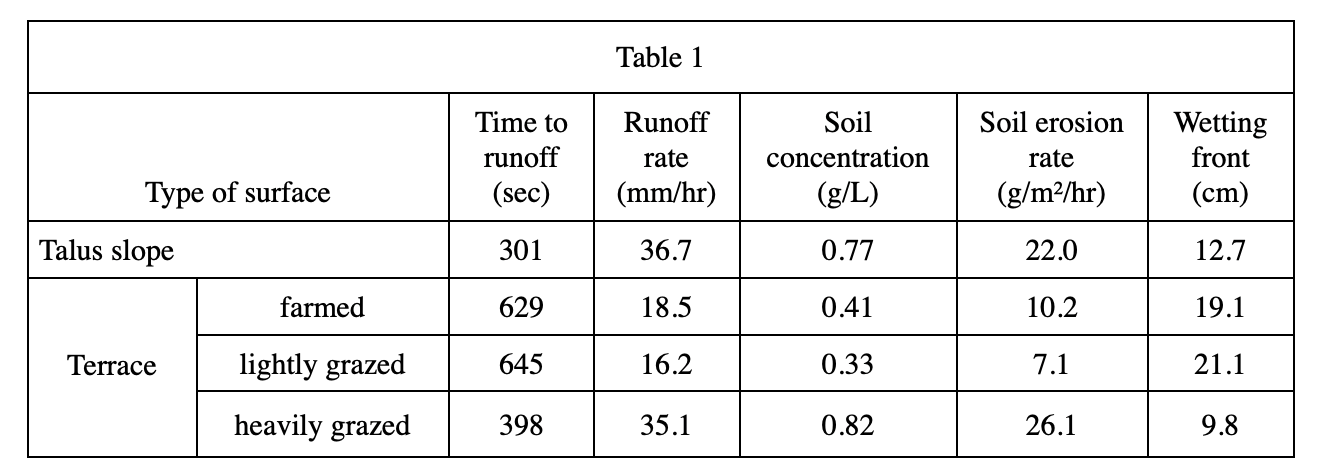
8. Which of the following graphs best represents the wetting front results in Table 1?
Answer and Explanation
Your Answer is
Correct Answer is F
Explanation
According to table 1, in the wetting front item, the maximum value corresponds to lightly grazed, and the minimum value corresponds to heavily grazed, so you should choose F