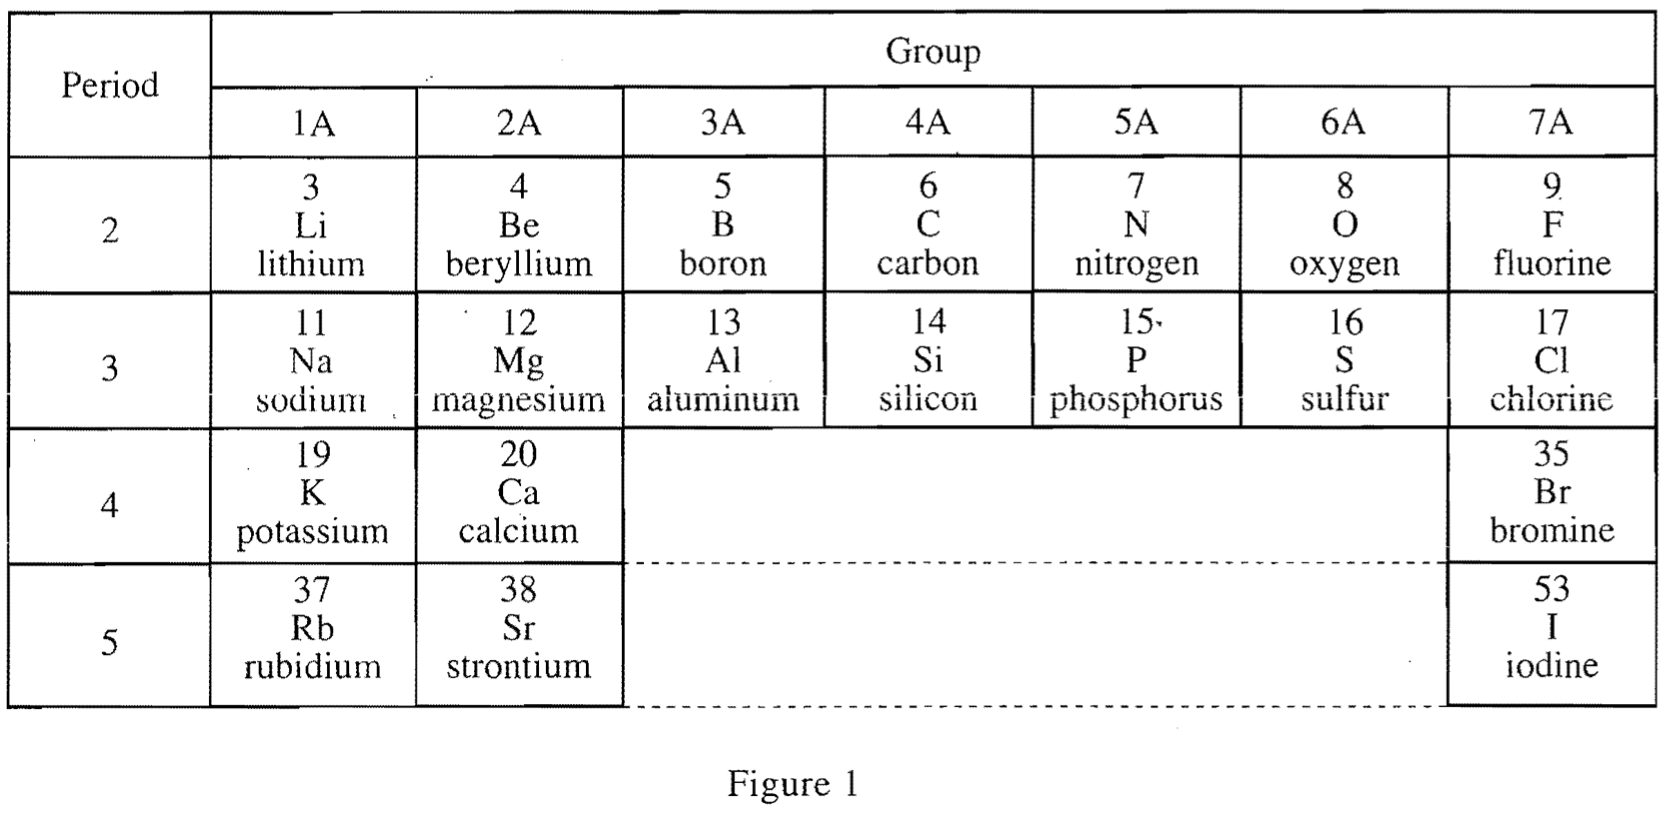
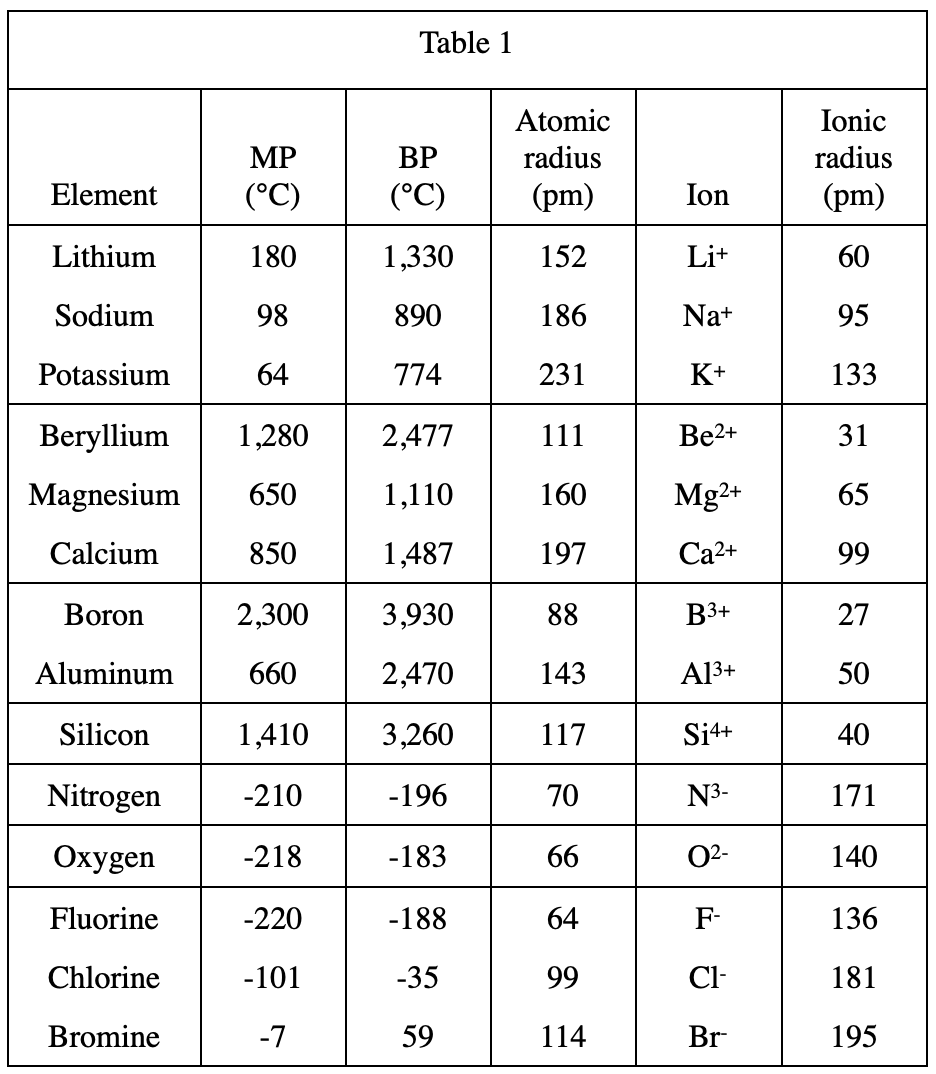
20. According to Figure 1 and Table 1, which of the following graphs best shows how MP varies with atomic number for the Group 2A elements listed in Table 1 ?
Answer and Explanation
Your Answer is
Correct Answer is F
Explanation
Look at figure 1 first, the elements corresponding to Group 2A are Be, Mg, Ca...the corresponding Mp in table 1 are 1280, 650, 850 respectively, so you should choose F