1. Which of the following graphs best represents how L varied with D in Trials 1-5?
Answer and Explanation
Your Answer is
Correct Answer is A
Explanation
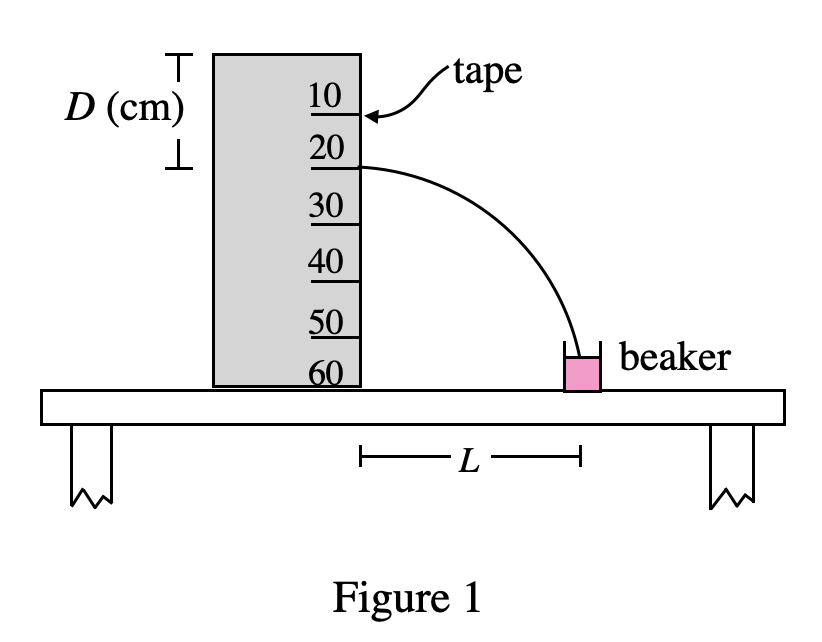
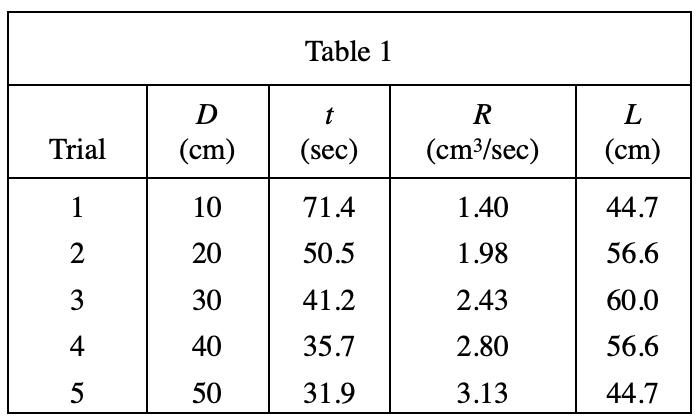
Looking at table 1, as D increases, L first increases and then decreases, so B & D is excluded;
Because D is 30 cm, L is 60 cm, so C is excluded
p>