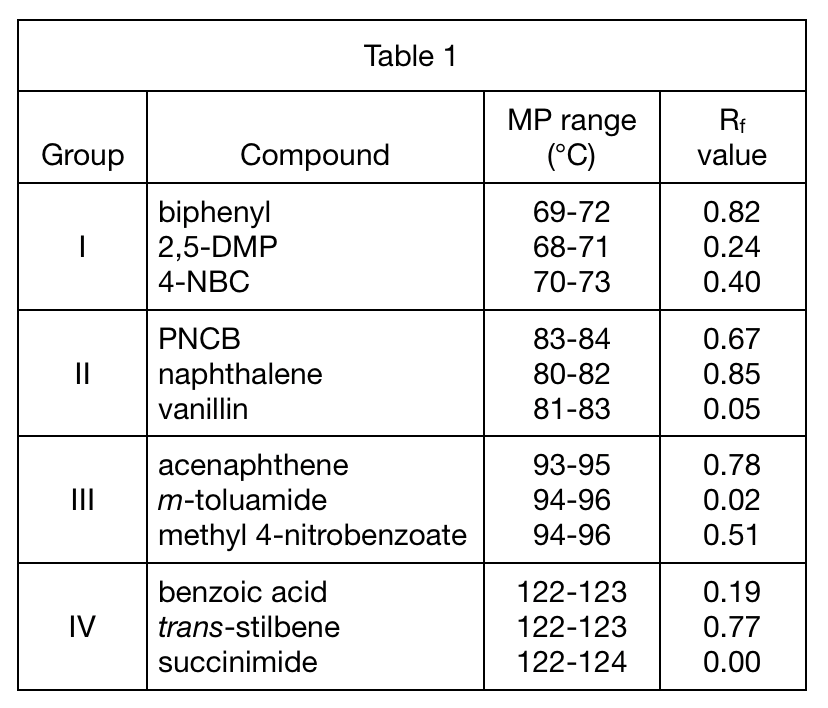
40. Which of the following diagrams best represents how the TLC plate appeared under UV light for Group II?
Answer and Explanation
Your Answer is
Correct Answer is F
Explanation
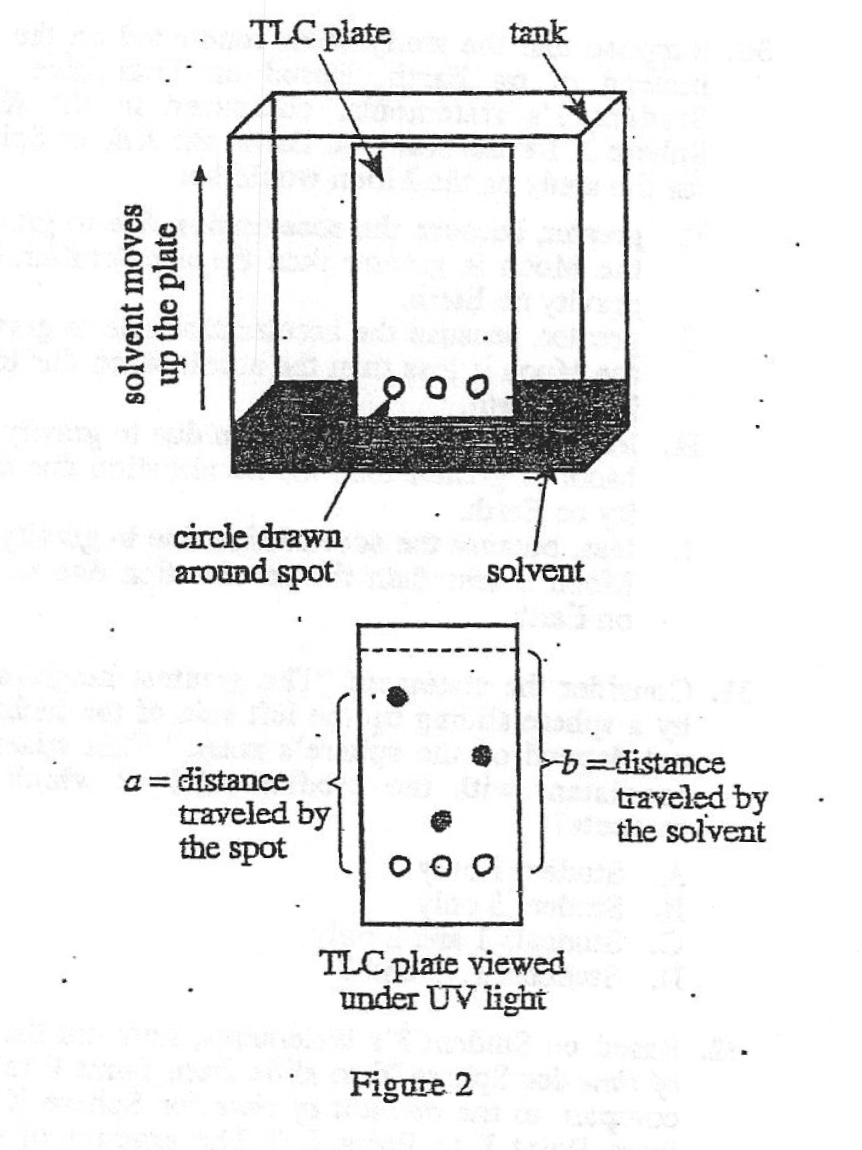
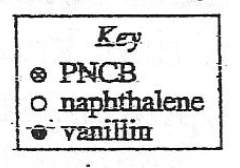
The larger the Rf value, the higher the spot.
Refer to table 1, the Rf values of the three compounds are sorted as naphthalene>PNCB>vanillin, so the hollow circle should be the highest, and the solid black dot should be the lowest