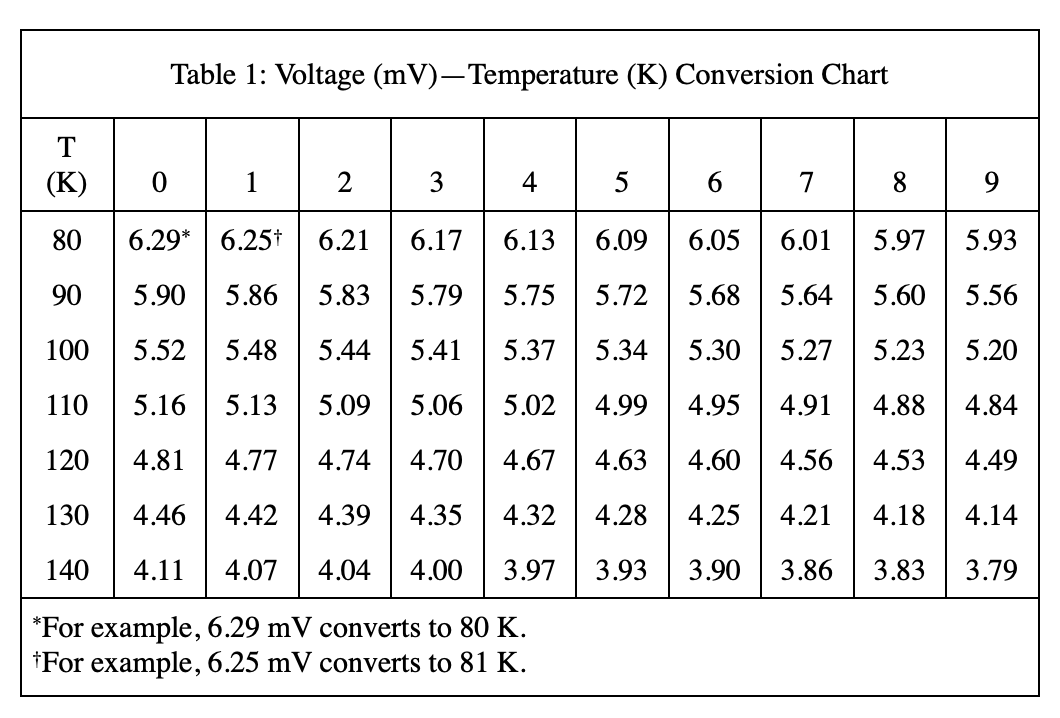
23. Based on Table 1, if the thermocouple were used to measure the temperature of a sample at 112 K, the voltage displayed would most likely be closest to which of the following ?
Answer and Explanation
Your Answer is
Correct Answer is B
Explanation
First of all, table 1 is a magical chart, which is relatively rare in the ACT science test. Please pay attention to the instructions marked with asterisks in the bottom two lines of the table. Take this question as an example, 112 K corresponds to the row 110, and the value in the column 2 is 5.09 mV