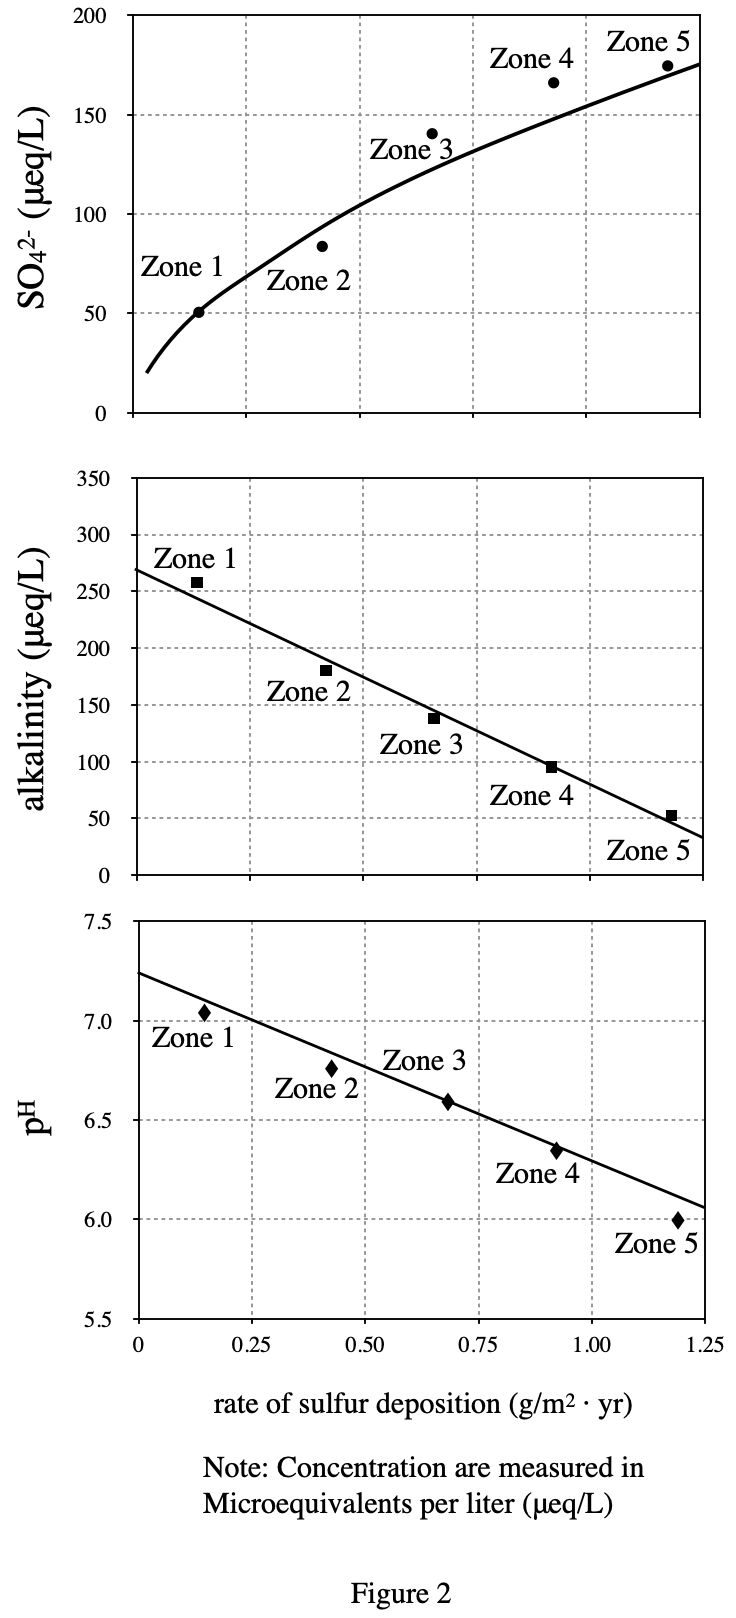
6. Based on the data in Figure 2, as the average rate of sulfur deposition increased, the average lake water pH:
Answer and Explanation
Your Answer is
Correct Answer is H
Explanation
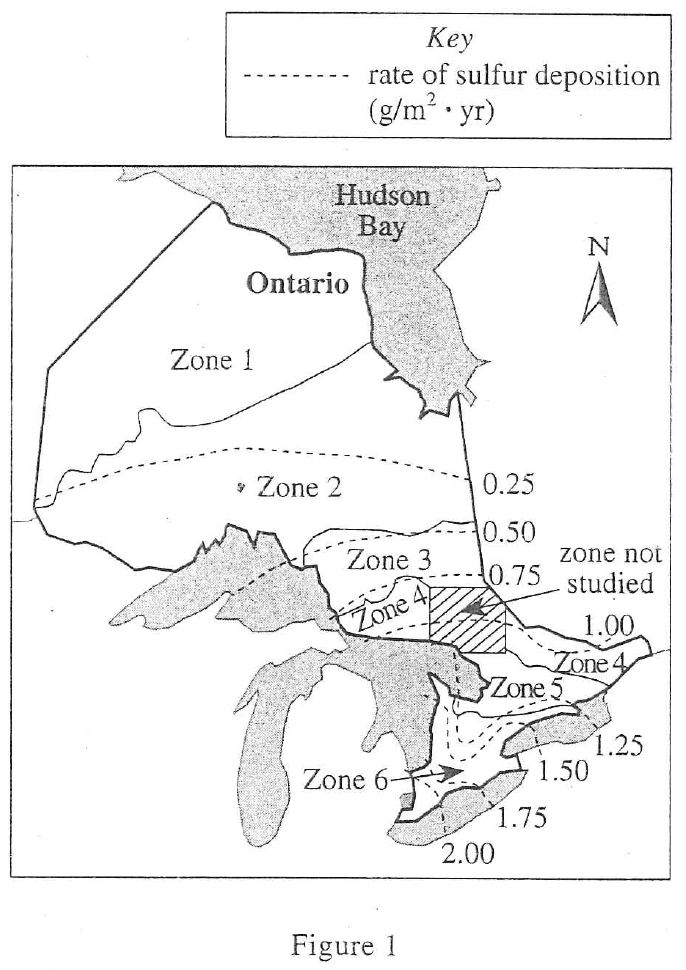
It can be seen from Figure 1 that from Zone 1 to Zone 5, the sulfur deposition increases sequentially; while Figure 2 shows that from Zone 1 to Zone 5, the pH decreases sequentially. So as the sulfur deposition increases, the pH should decrease.