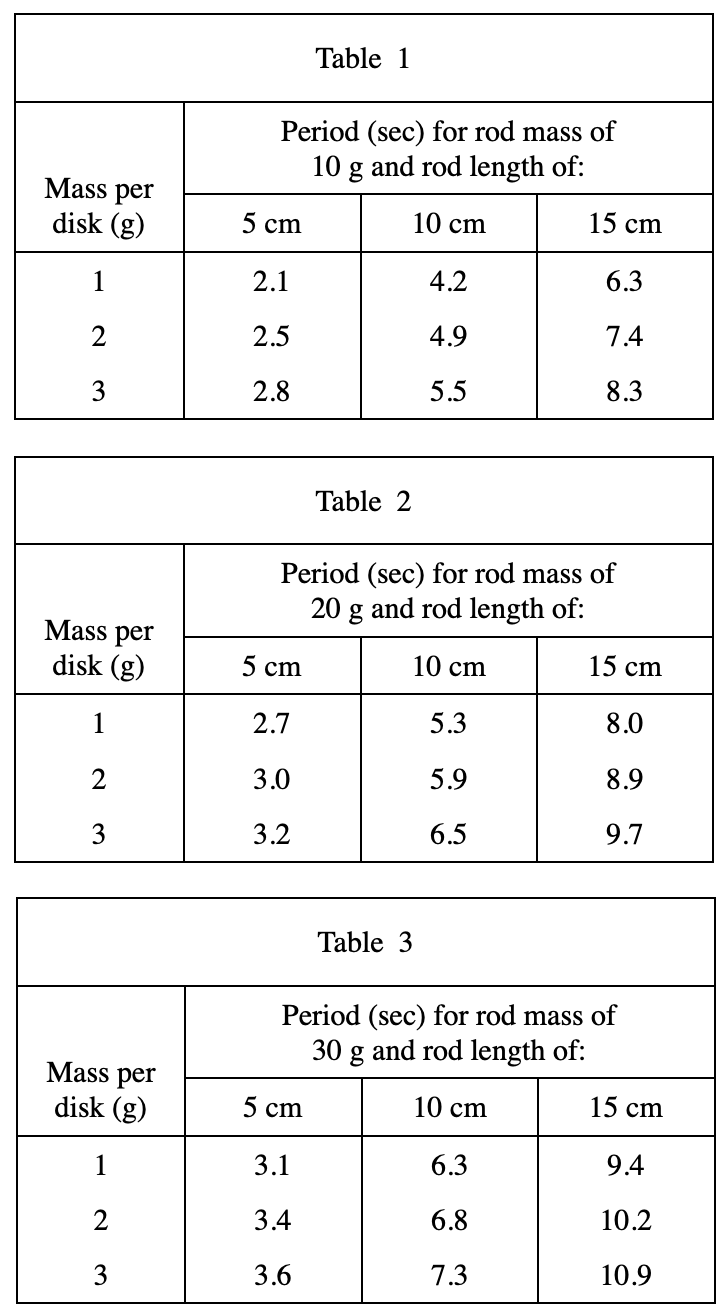
17. Based on the data in Table 3, which of the following bar graphs best represents the periods of the torsion pendulums having a rod mass of 30 g, a rod length of 10 cm, and a mass per disk of 1 g, 2 g, or 3 g?
Answer and Explanation
Your Answer is
Correct Answer is B
Explanation
Look at the values corresponding to the group of 10 cm in the middle of Table 3. When the mass per disk is 1, 2, and 3, the Period corresponds to 6.3, 6.8, and 7.3 respectively. The period increases at a time, so option B is reasonable.