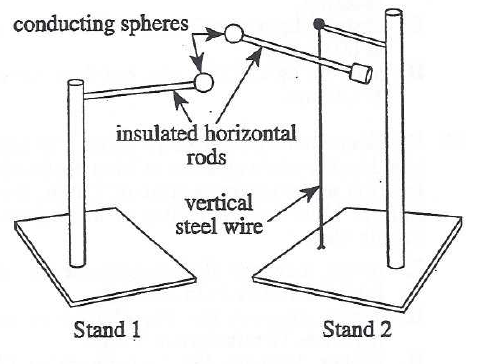
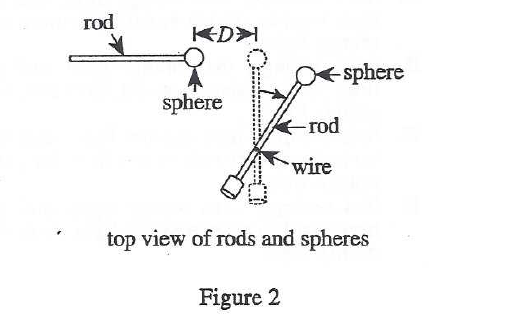
28. The results of Study 2 are best represented by which of the following graphs?
Your Answer is
Correct Answer is G
Explanation
Looking at table 2, when the charge of B increases, θ decreases, but the curves in F, H, and J options are all increasing or flat, so we can only choose G< /p>

