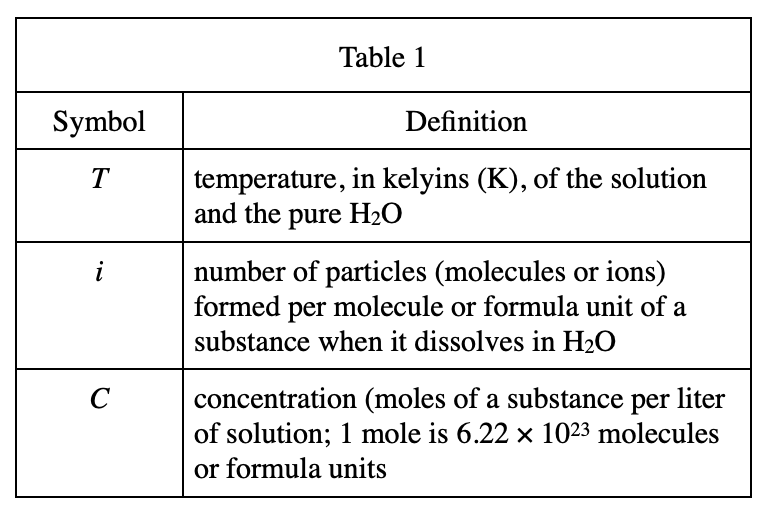
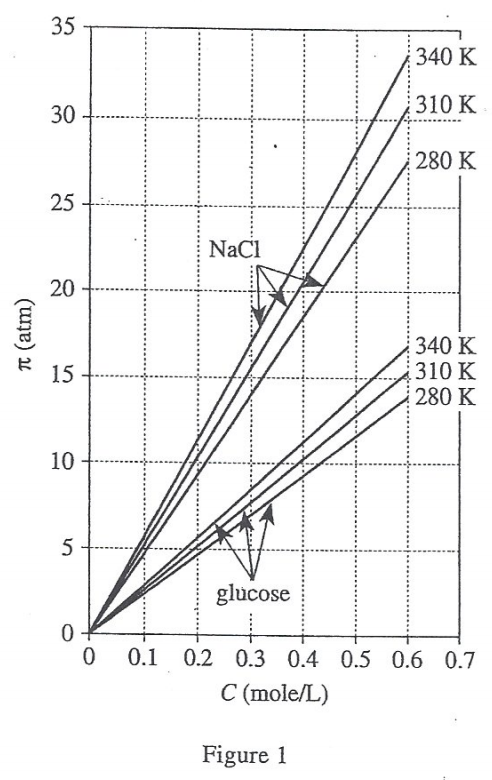
40. Suppose a new line showing how π varies for aqueous MgCl2 solutions at 340 K were added to Figure 1. How would this new line compare to the lines shown in Figure 1 for aqueous NaCl solutions and aqueous glucose solutions at 340 K ?
Answer and Explanation
Your Answer is
Correct Answer is F
Explanation
Comparing the line segments of NaCl at 340K and glucose at 340K in figure 1, it is found that the larger i is, the larger π will be.
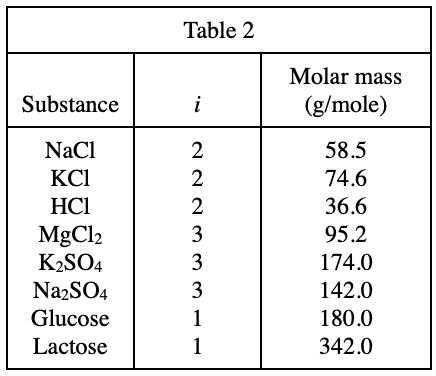
According to table 2, i=3 of MgCl2 is larger than i=2 of NaCl, so the π corresponding to MgCl2 is larger, and the line segment The slope is larger. And because the starting point of the line segment is (0,0), the intercept on the y-axis is the same