


15. The results of Study 1 are best represented by which of the following graphs?
Answer and Explanation
Your Answer is
Correct Answer is D
Explanation
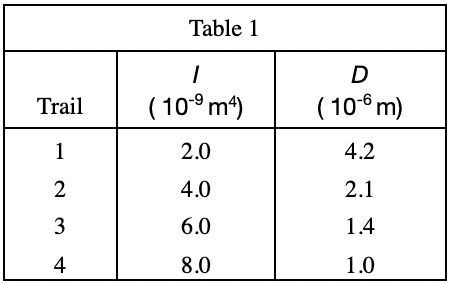
Look at table 1, where I is the independent variable and should be placed on the X-axis, D is the dependent variable and should be placed on the Y-axis, so exclude A & B;
From table 1 It can be seen from the numerical value that as I increases, D decreases, so C is excluded