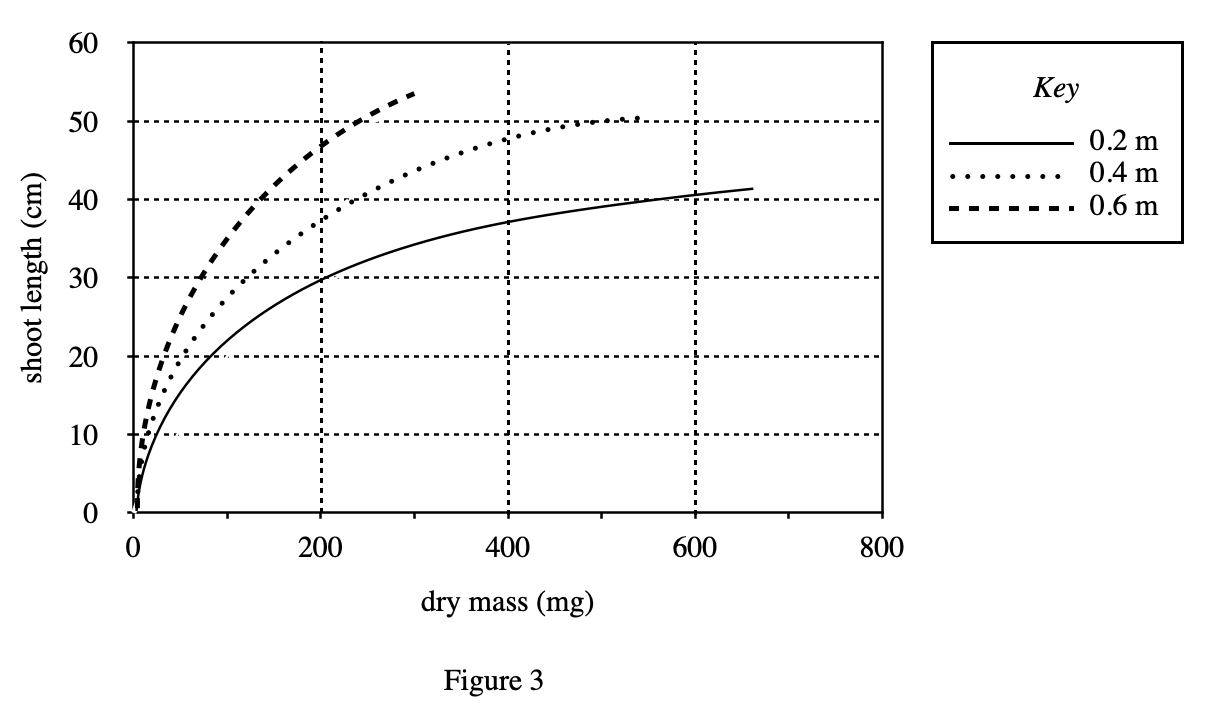
4. Which of the following sets of data points most likely yielded the best-fit curve for surviving Species B seedlings grown at a depth of 0.4 m?
Answer and Explanation
Your Answer is
Correct Answer is J
Explanation
According to figure 3, it can be seen that the dotted line with depth=0.4 m is closest to option J