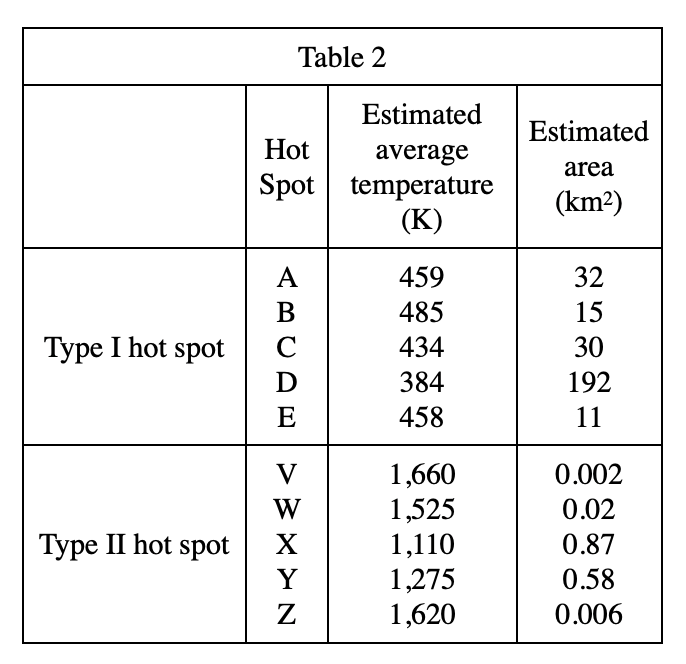
3. Which of the following graphs best represents the estimated average temperatures of Hot SpotsA, B, and C ?
Answer and Explanation
Your Answer is
Correct Answer is B
Explanation
Look at table 2, the average temperature of points A, B and C are about 459 K, 485 K, and 434 K