
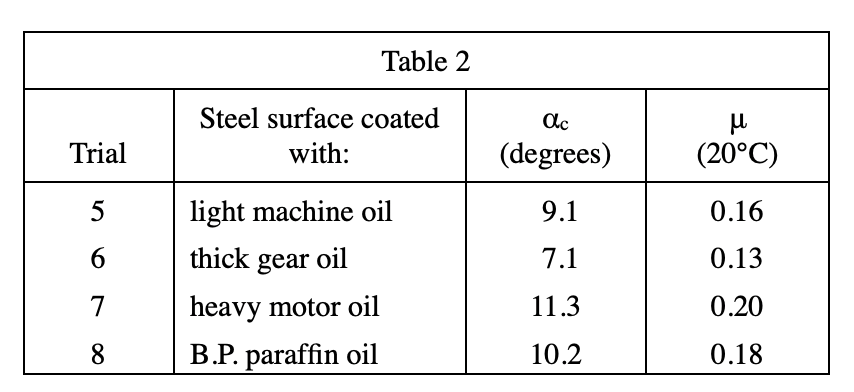
25. Based on the data in Tables 2 and 3, which of the following bar graphs best represents µ for light machine oil and thick gear oil at 20° and 100°C ?
Answer and Explanation
Your Answer is
Correct Answer is B
Explanation
Look at table first, at 20 degrees, μ=0.16 of light machine oil, and μ=0.13 of thick gear oil;
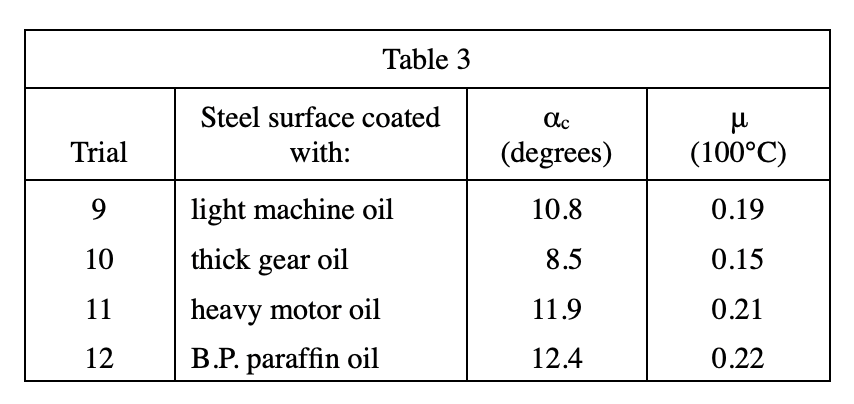
Look at table 3 again, at 100 degrees, μ=0.19 of light machine oil , μ=0.15 of thick gear oil. For the two oils, the general trend is that the higher the temperature, the larger the μ, so the option B is in line with this general trend