
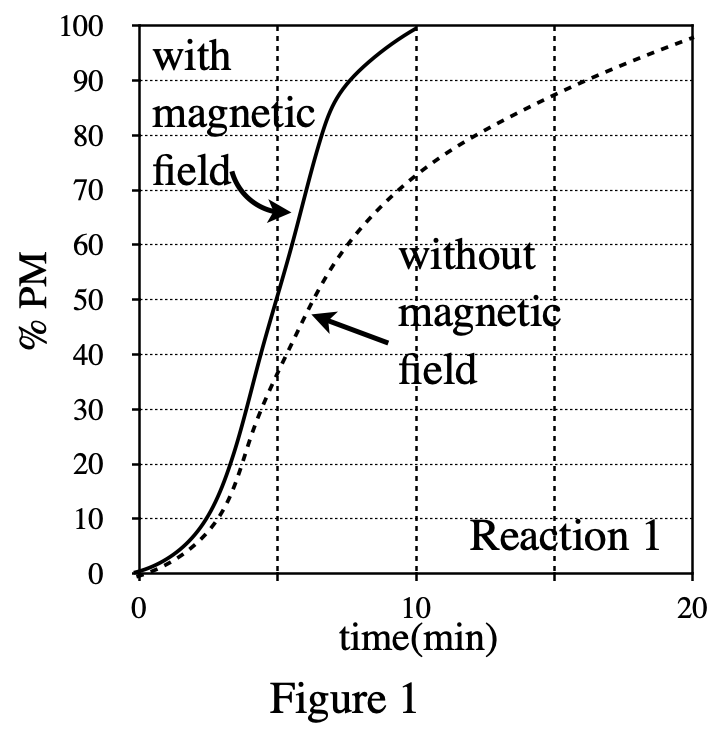
23. Suppose that Figure 1 had instead been plotted as percent of metal oxide (% MO) versus time:
% MO =
Which of the following graphs best shows how Figure 1 would have appeared?
Answer and Explanation
Your Answer is
Correct Answer is A
Explanation
If the ordinate in figure 1 is changed to %MO, then it should be 100% at the beginning of the reaction, and the final reaction is 0%, excluding C & D;
You can see it in the original picture The reaction is faster under the condition of the solid line with magnetic field, so the %MO drops to 0 first with the magnetic field (solid line), so choose A