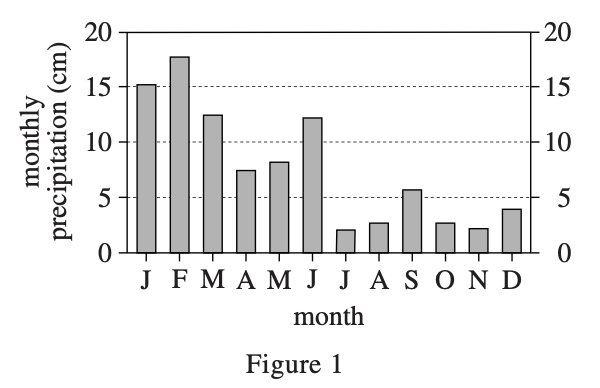
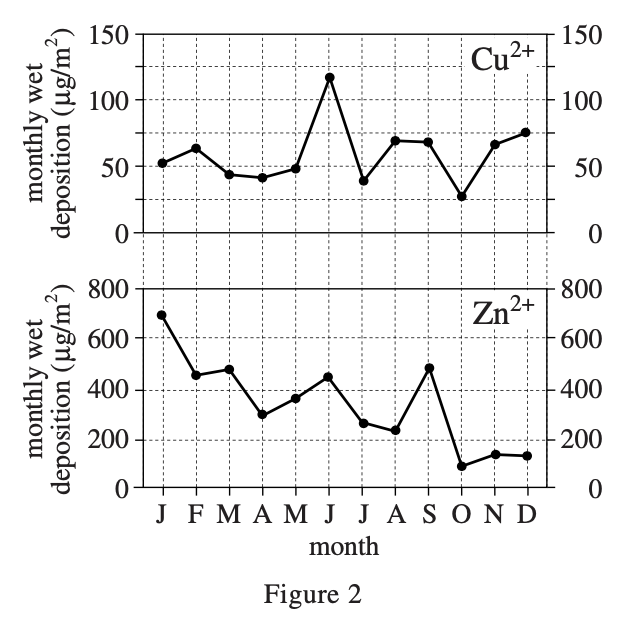
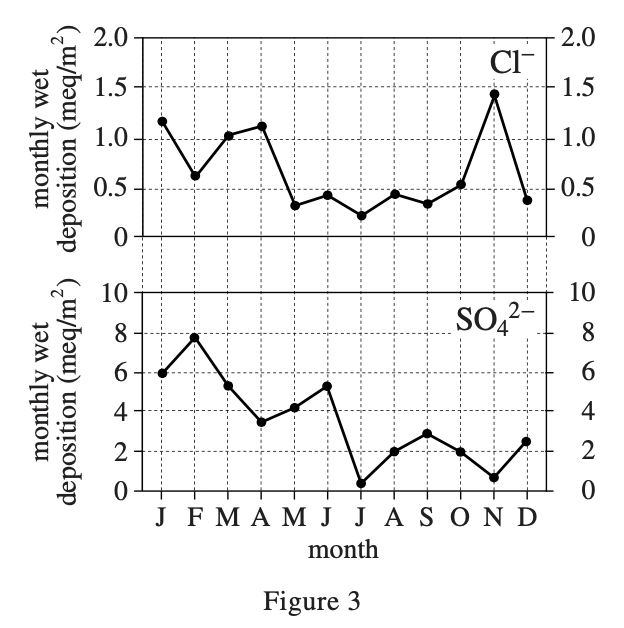
7. According to Figure 1, over the 12-month period, the monthly precipitation at the urban site was maximum in February and minimum in July. According to Figures 2 and 3, the wet deposition of which ion was also maximum in February and minimum in July?
Answer and Explanation
Your Answer is
Correct Answer is D
Explanation
Looking at the vertical coordinates of each chart in figure 2 and figure 3, the maximum value is reached in February, and the minimum value is reached in July. The one that meets this condition is SO42-