Answer and Explanation
Your Answer is
Correct Answer is F
Explanation

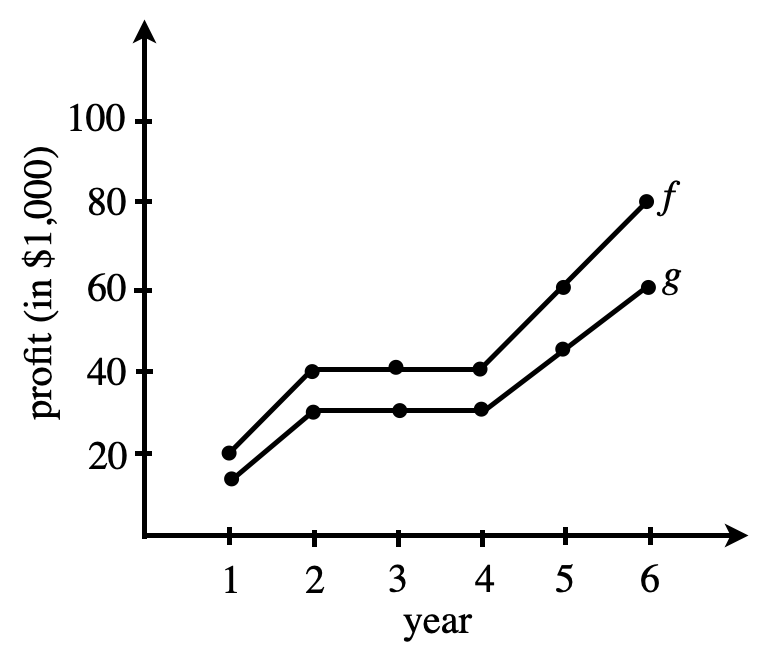
38. The function f shown in the graph below represents the projection of yearly profits for the Rip It Up toy company. The actual profits are represented by the graph of the function g. Which of the following descriptions is the most accurate explanation for the variation between the graph of g and the graph of f ?
Your Answer is
Correct Answer is F
Explanation