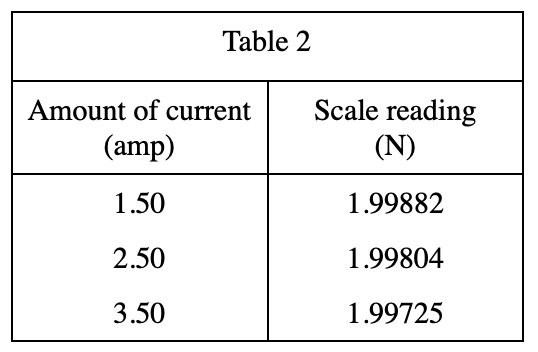
22. The results of Experiment 2 are best represented by which of the following graphs?
Answer and Explanation
Your Answer is
Correct Answer is G
Explanation
Look at table 2, when current increases, scale reading decreases, excluding F and H. But all scale readings are lower than 2.00000, so exclude J