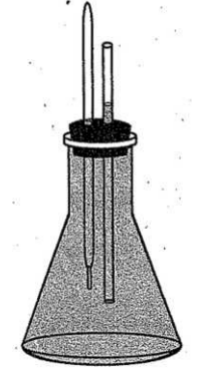
37. Which of the following graphs best shows how the volume of the liquid H2O changed with temperature in Experiment 2 ?
Your Answer is
Correct Answer is B
Explanation
According to the text part of Experiments 1 & 2, it can be inferred that water has the smallest volume (that is, the highest density) at 4°C, so B is right
