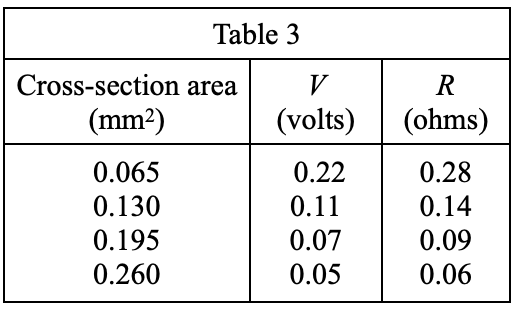
18. The results of Study 3 are best represented by which of the following figures?
Answer and Explanation
Your Answer is
Correct Answer is J
Explanation
Look at table 3, when the cross-section area increases, R decreases, so it should be a descending line segment