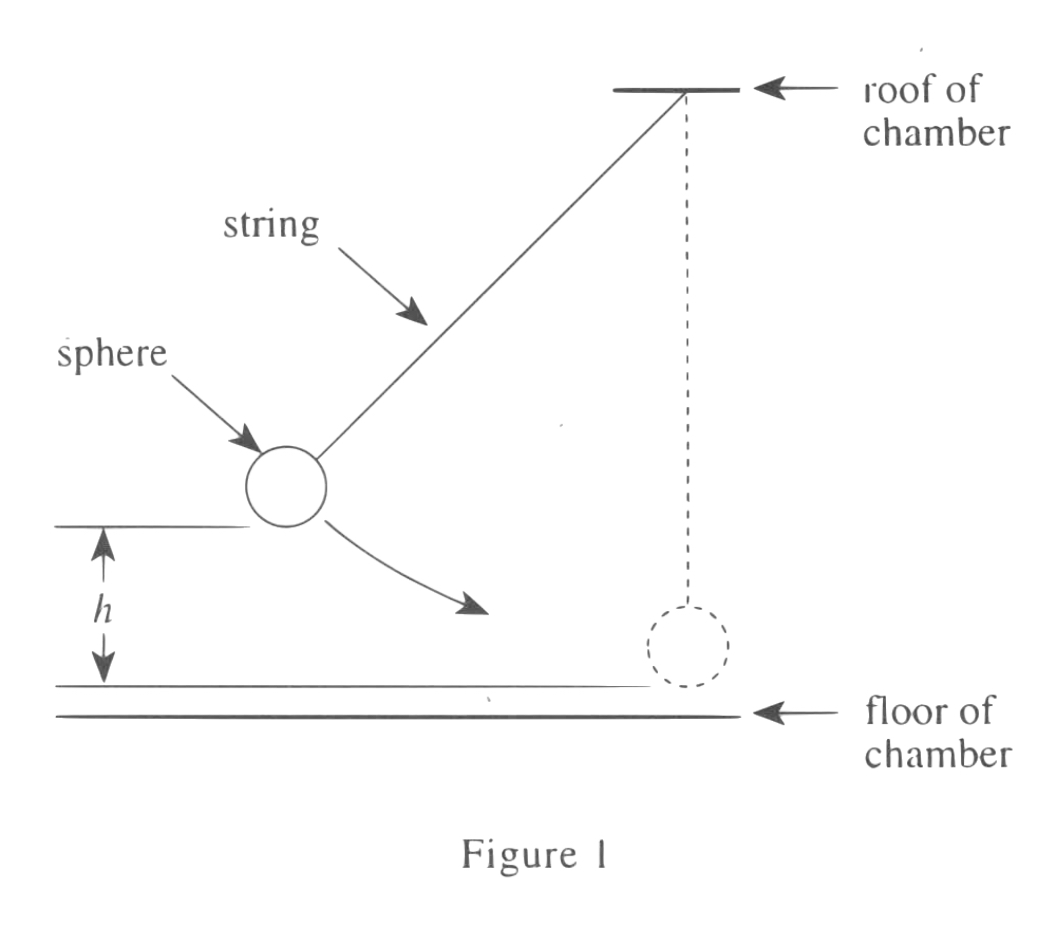
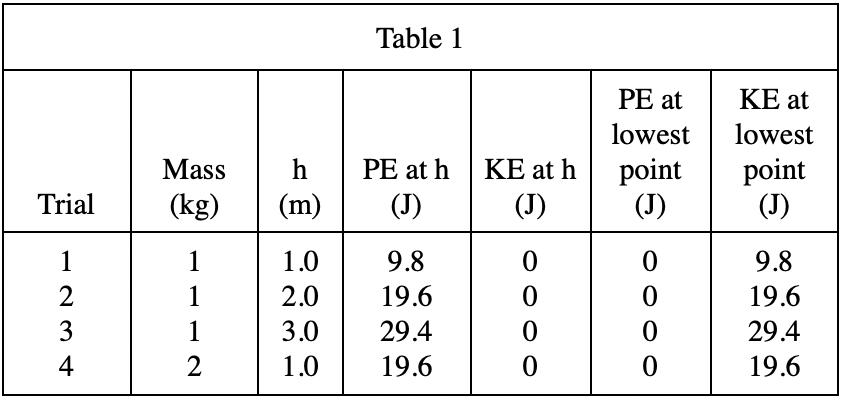
27. Based on the results of Experiment 1, the relationship between h and the potential energy of a given sphere is best represented by which of the following graphs?
Answer and Explanation
Your Answer is
Correct Answer is B
Explanation
According to the formula EP=mgh, EP is proportional to h, if h increases, EP also increases