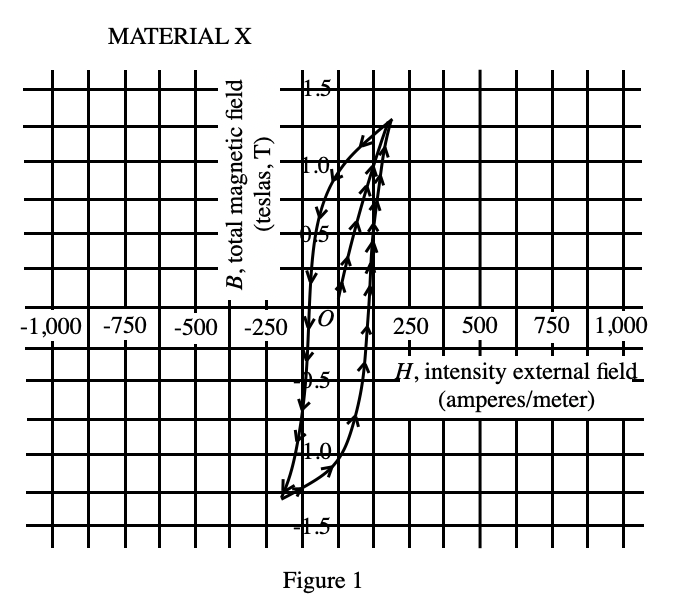
40. Consider the most positive value of B and the most negative value of B on the graph in Figure 1. How are these two values of B related? The most negative value of B is equal to:
Answer and Explanation
Your Answer is
Correct Answer is F
Explanation
Look at figure 1, the graph is symmetrical about the X axis, and the maximum and minimum values are only the difference between positive and negative. So, (-B)×(-1)=+B