6. The results of Study 4 are best represented by which of the following graphs?
Answer and Explanation
Your Answer is
Correct Answer is G
Explanation
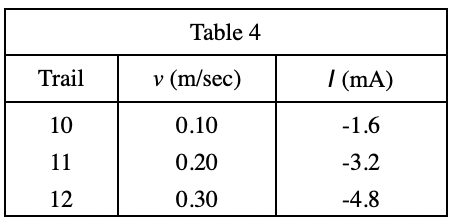
Look at table 4, because I is negative, so exclude F & H;
As v increases, I gets smaller and smaller, so exclude J