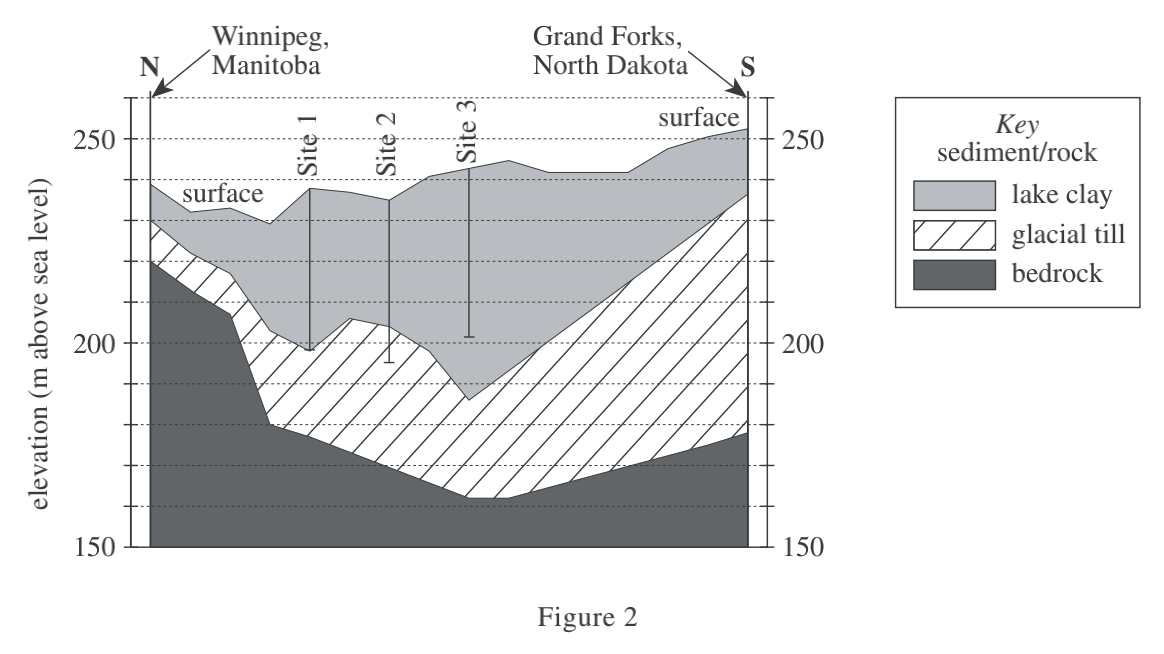
9. According to Figure 2, which of the following graphs best represents the elevations, in m above sea level, of the top of the glacial till layer at Sites 1, 2, and 3 ?
Answer and Explanation
Your Answer is
Correct Answer is C
Explanation
Look at figure 2, the altitude of the glacial till is the highest at Site 2, and the altitude of the glacial till is the lowest at Site 3