Answer and Explanation
Your Answer is
Correct Answer is D
Explanation
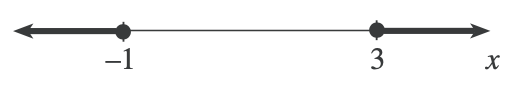
It can be seen from the figure that x≤ -1, 3≤x, so choose D
49. The number line graph below is the graph of which of the following inequalities?
Your Answer is
Correct Answer is D
Explanation
It can be seen from the figure that x≤ -1, 3≤x, so choose D