
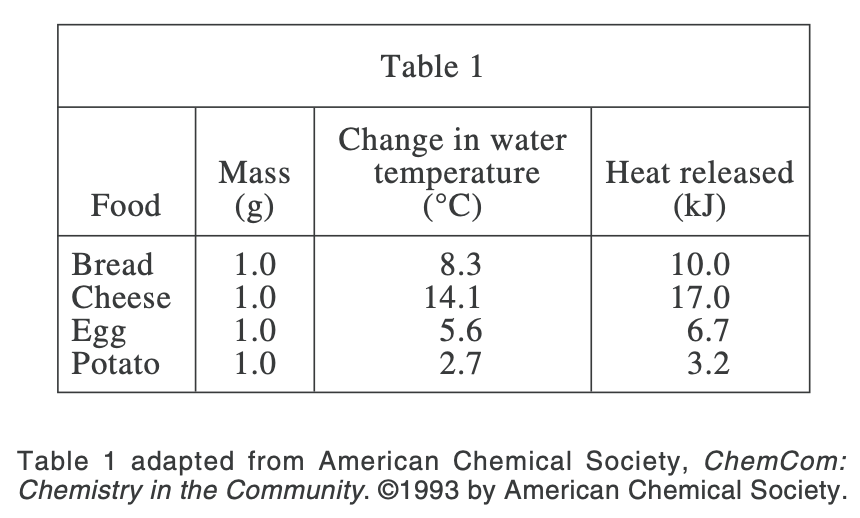
21. Which of the following graphs best illustrates the relationship between the heat released by the foods listed in Table 1 and the change in water temperature?
Answer and Explanation
Your Answer is
Correct Answer is B
Explanation
Looking at table 1, the greater the heat released, the greater the change in water temperature, so the line in the coordinate diagram should be the rise of the vertical axis and the horizontal axis, and B conforms