 (see Figure 1).
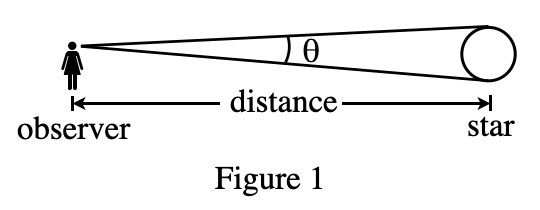
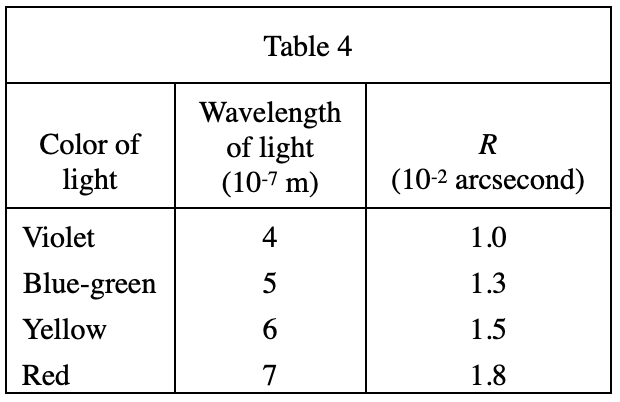
7. Based on Table 4, which of the following graphs best illustrates the relationship between R and the wavelength of light?
Answer and Explanation
Your Answer is
Correct Answer is A
Explanation
Look at table 4, the larger the wavelength, the larger the R, so it should be option A