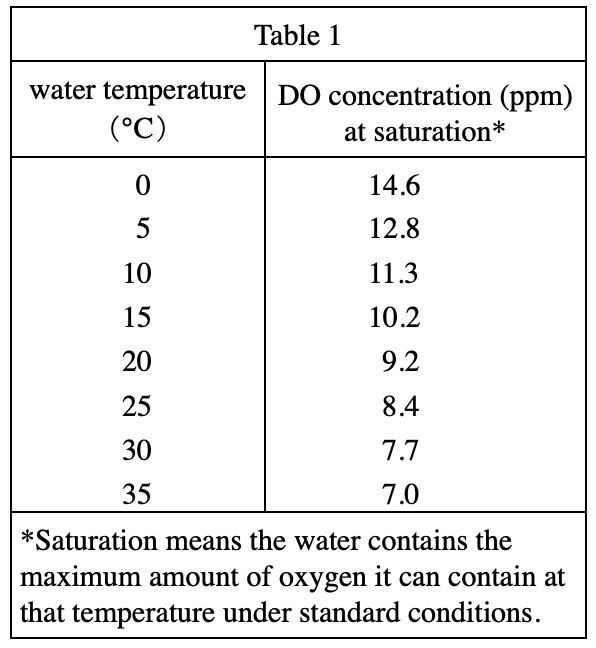
34. Which of the following graphs best represents the relationship between water temperature and DO concentration at saturation shown in Table 1?
Answer and Explanation
Your Answer is
Correct Answer is F
Explanation
According to table 1, as the water temperature increases, the DO concentration decreases, so H & J are excluded;
See when the water temperature is 0°C, the DO concentration is 14.6, so G is excluded
p>