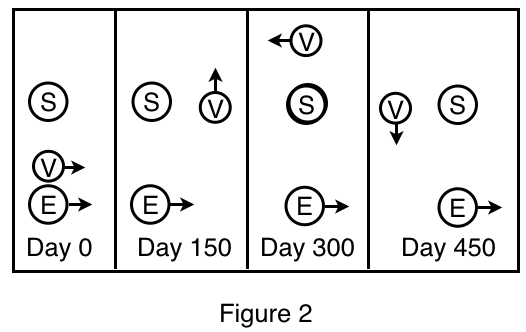
28. Suppose, on Day 0 in Experiment 2, the relative positions of the Sun, Earth, and Venus were as shown in the diagram below.

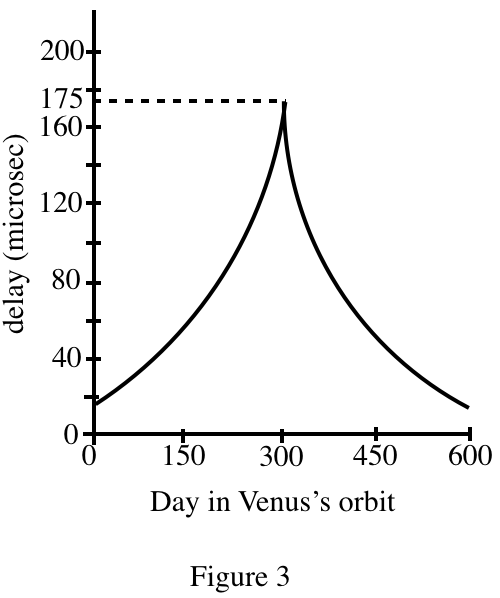
The graph of the delay versus Day would have looked most like which of the following graphs?
Answer and Explanation
Your Answer is
Correct Answer is F
Explanation
The schematic diagram of Day 0 given in the title is equivalent to Day 300 in figure 2. At this time, the delay should be the largest, so choose F