 ). The percent saturation of Hb is the percent of hemoglobin in the blood that is bound with O2. Figure 1 shows the relationship between percent saturation of Hb and
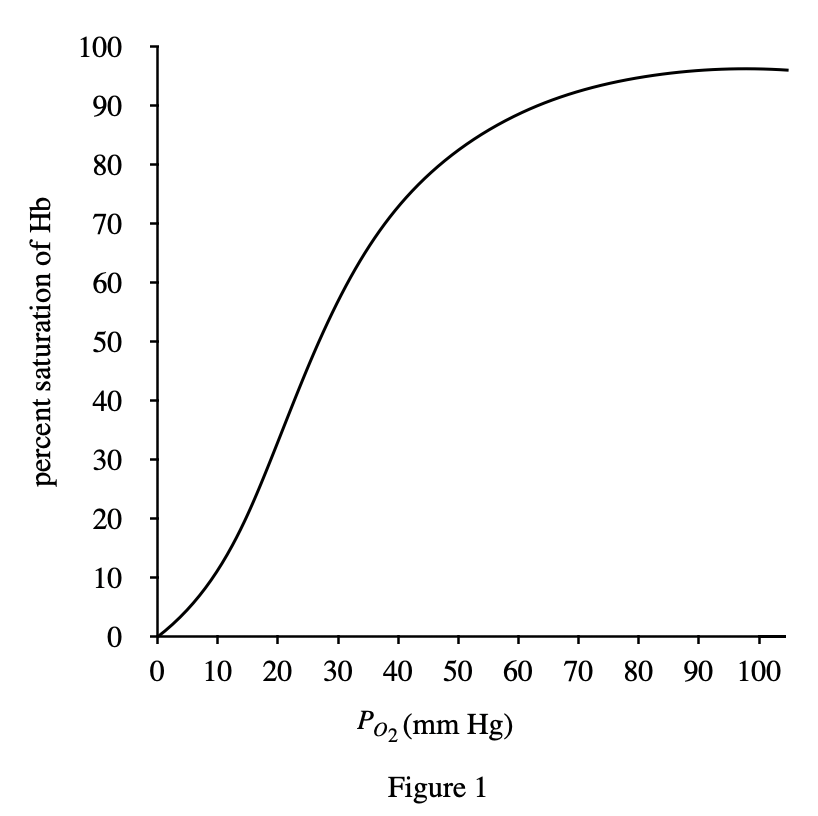
39. Which of the following tables represents the assumptions about temperature and pH that would have to be made to properly interpret the data in Figures 1-3?
Answer and Explanation
Your Answer is
Correct Answer is D
Explanation
In Figure 1, pH and temperature are not involved, indicating that pH and temperature are fixed at this time;
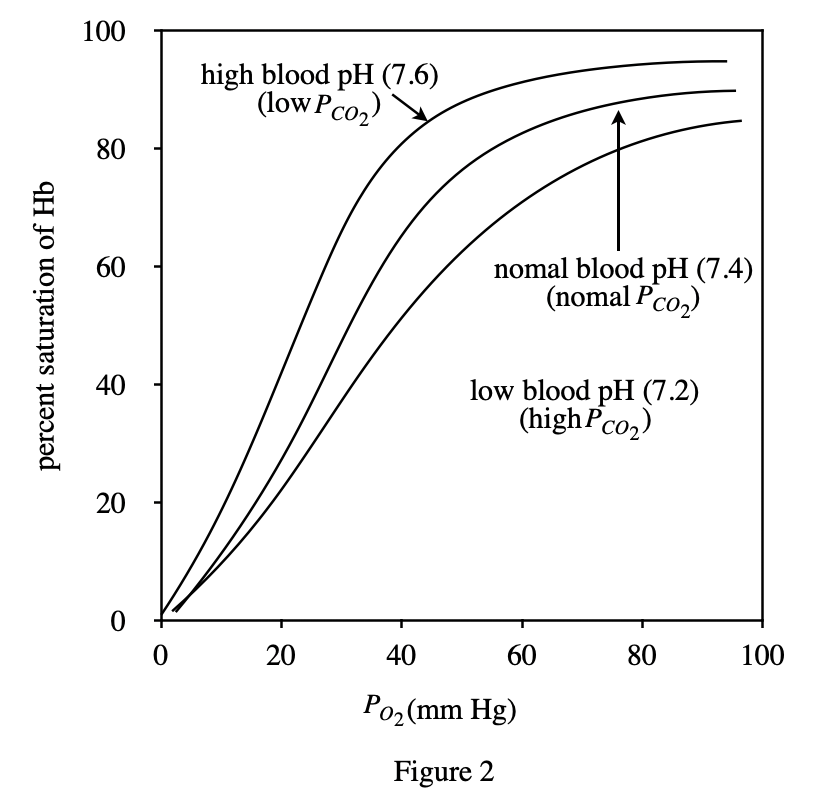
The variable in figure 2 is pH, while temperature is fixed;
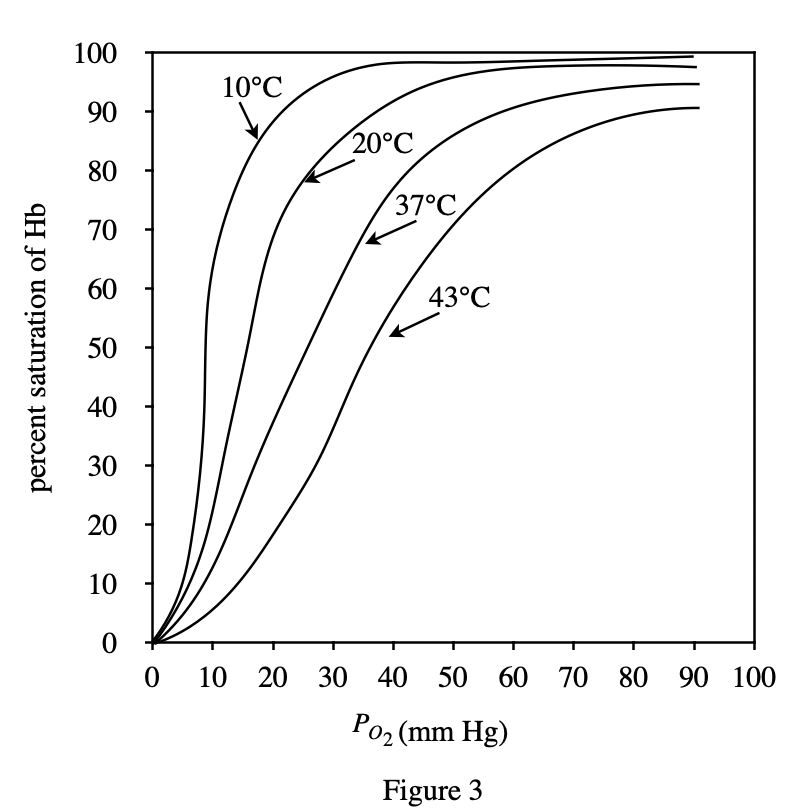
The variable involved in p>figure 3 is temperature, and the pH is a fixed value