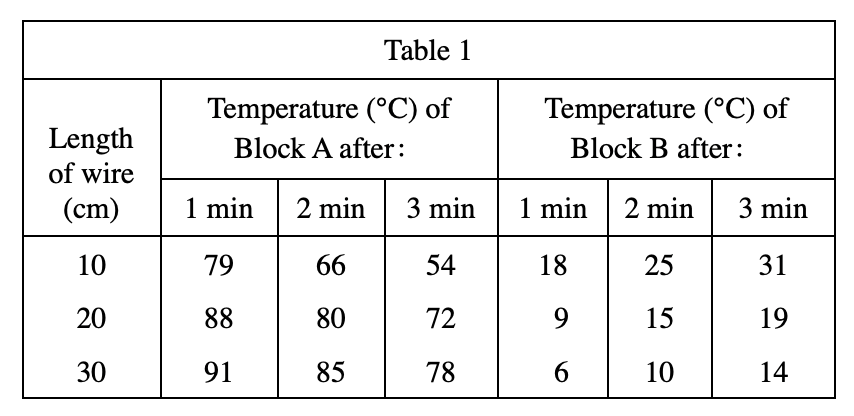
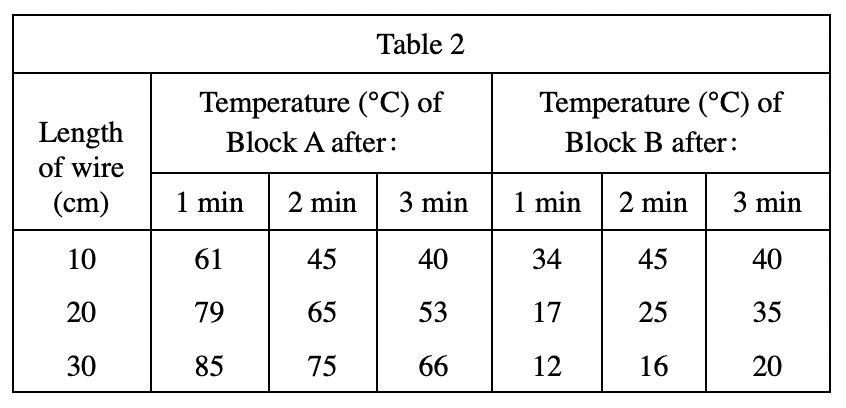
27. Based.on Experiments 1 and 2, which of the following graphs best represents the relationship between the length of a copper wire of a given diameter and the temperature of Block A at a given time?
Answer and Explanation
Your Answer is
Correct Answer is C
Explanation
Look at either table 1 or table 2. Taking table 1 as an example, the diameter is fixed. As the length of wire increases, after 3 minutes, the temperature of Block A will be higher, so it should be C