2. Which of the following figures best represents the relationship between erosion rate in limestone bedrock catchments and total annual precipitation?
Answer and Explanation
Your Answer is
Correct Answer is F
Explanation
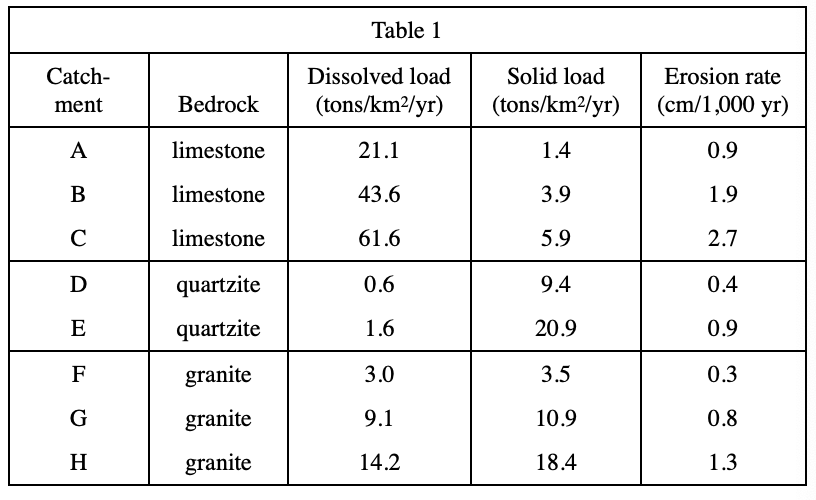
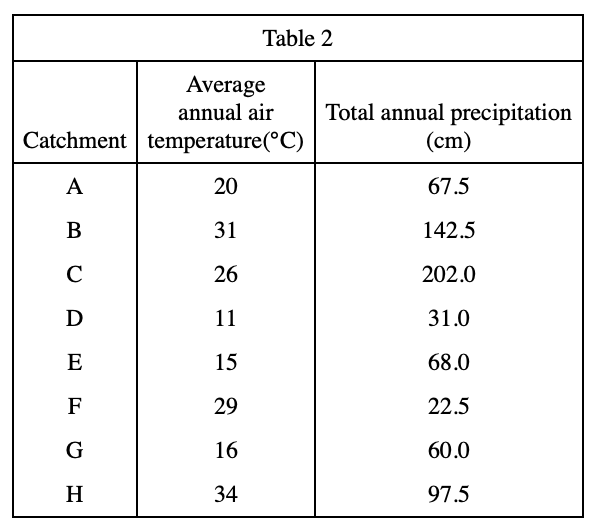
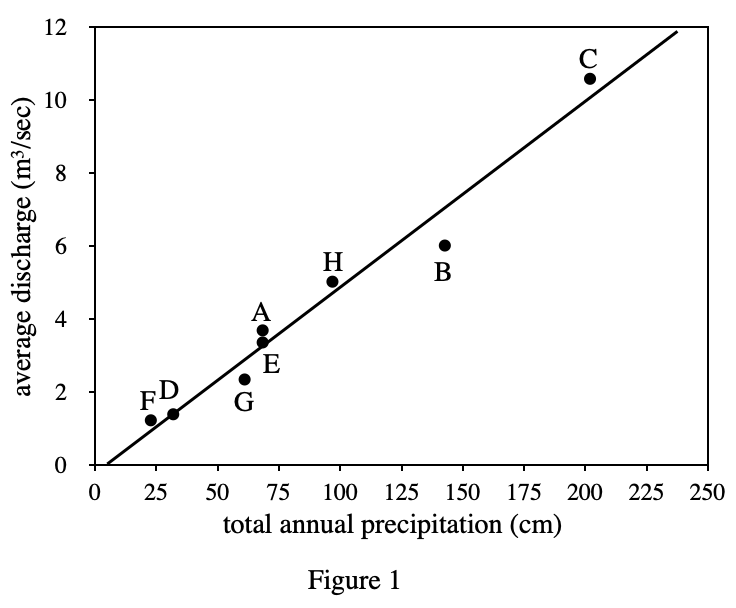
For this question, you need to contact Table 1 and Figure 1. Find the erosion rate in Table 1, and then go to Figure 1 to find the precipitation corresponding to the letter. It is not difficult to find that the greater the precipitation, the faster the corrosion rate , is directly proportional, so choose F.