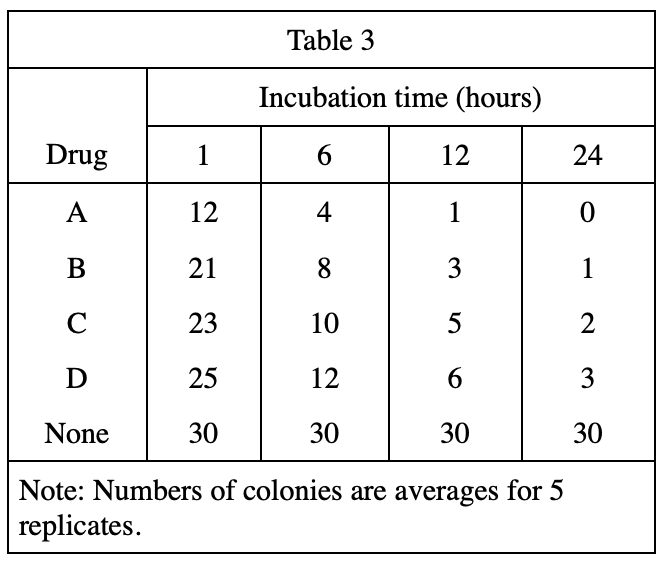
22. Which of the following graphs best shows the relationship between incubation time and colonies counted in Experiment 3 ?
Answer and Explanation
Your Answer is
Correct Answer is J
Explanation
From table 3, it can be seen that Drug A has the least number of colonies at each time, and the number of colonies corresponding to None is the largest and has always remained 30, so you should choose J