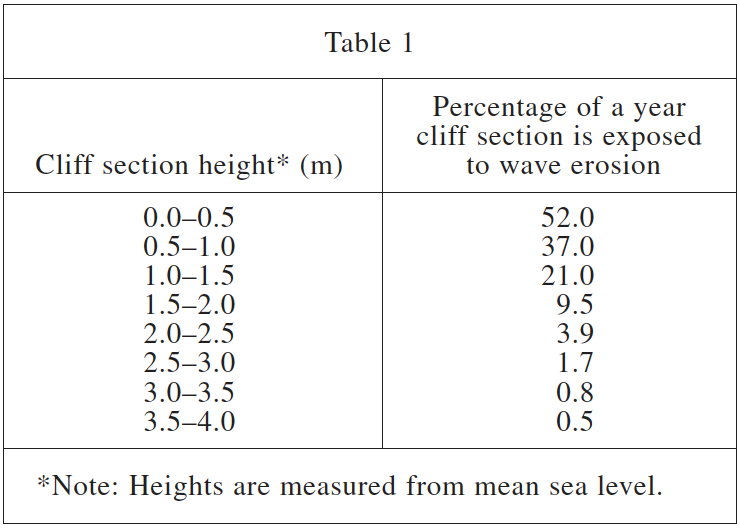
28. According to Table 1, which of the following figures best represents the relationship between the height of a cliff section and the percentage of a year that a cliff section is exposed to wave erosion?
Answer and Explanation
Your Answer is
Correct Answer is F
Explanation
From table 1, it can be seen that the higher the cliff section height, the smaller the percentage of a year cliff section is exposed to wave erosion. So exclude H & J;
Look at table 1 again, and find that the lower the height, the faster the percentage decreases. When the height is higher, the percentage change is much smaller, so you should choose F