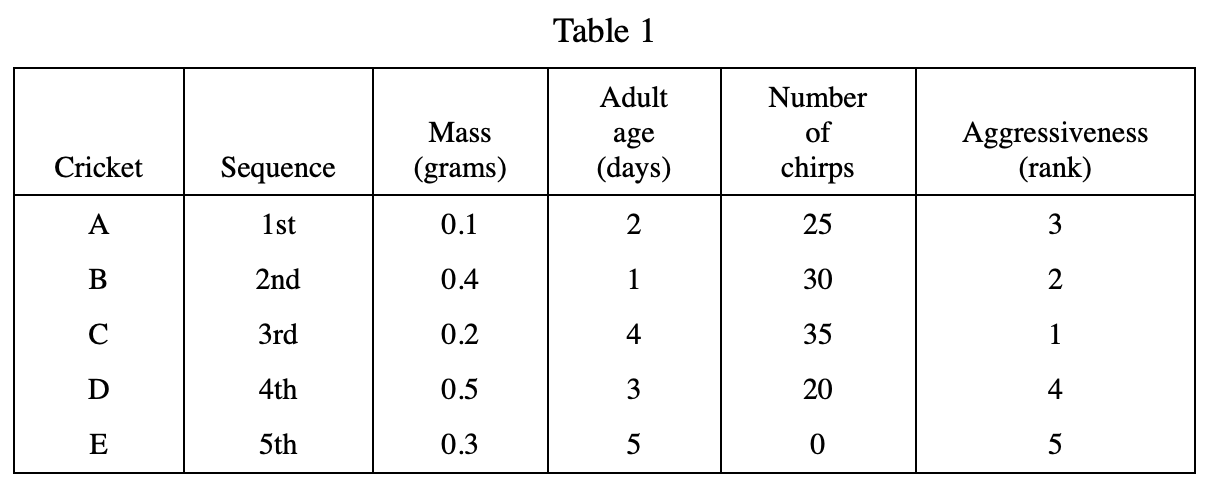
6. Which of the following graphs best represents the relationship between cricket mass and age as an adult?
Answer and Explanation
Your Answer is
Correct Answer is H
Explanation
When encountering the type of relationship trend graph between two variables, first find the independent variable age, from the smallest age to the largest age, remember the ups and downs of mass, and quickly analyze the right graph