30. Which of the following data is represented on the x-axis of Figure 2 ?
Answer and Explanation
Your Answer is
Correct Answer is G
Explanation
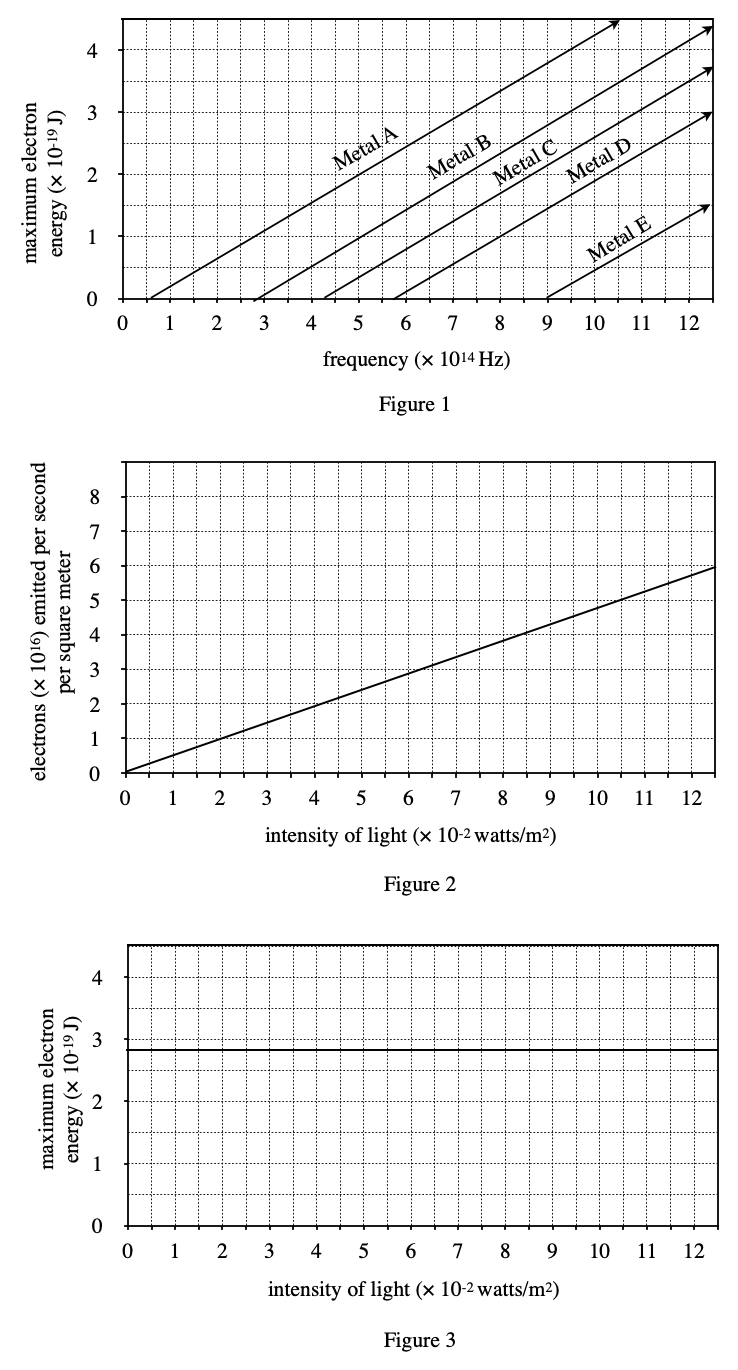
Read the answer directly from the label on the abscissa of figure 2: intensity of light
Passage VI
Light causes some metals to eject electrons. The energy of those electrons, in joules (J), depends on the light frequency and the kind of metal. Figure 1 shows how the maximum energy of ejected electrons varies with frequency, in hertz (Hz), for 5 metals. Figure 2 shows how the number of electrons emitted by a metal varies with the intensity of light at a constant frequency. Figure 3 shows the maximum energy an ejected electron can have for a given intensity of light at a constant frequency.
30. Which of the following data is represented on the x-axis of Figure 2 ?
Your Answer is
Correct Answer is G
Explanation
Read the answer directly from the label on the abscissa of figure 2: intensity of light