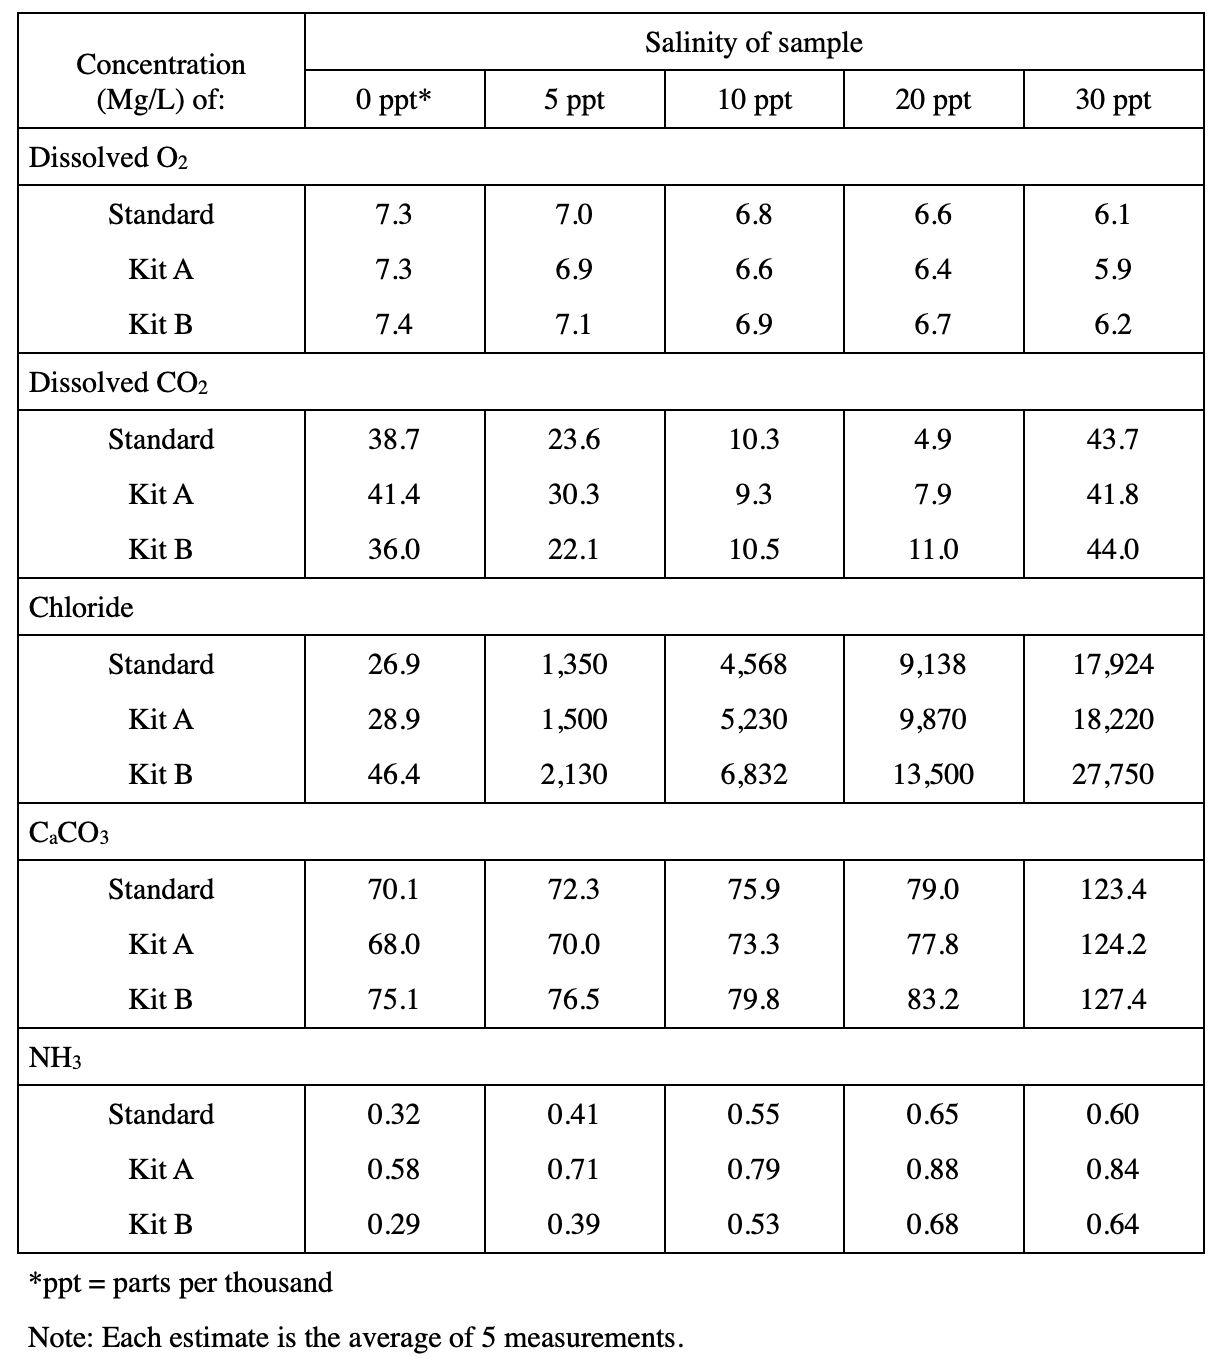
22. Which of the following graphs best represents the relationship between the level of salinity and the concentration of dissolved CO2, as estimated by Kit A ?
Answer and Explanation
Your Answer is
Correct Answer is H
Explanation
Find the big row of CO2 in the table, and locate the small row of Kit A. From left to right, Salinity increases sequentially, the first four data of dissolved CO2 concentration keep decreasing, and the last group has a big increase, which conforms to H option.