1. Which of the following figures best represents the iron concentrations at Outlet 2 for the 5-day period?
Answer and Explanation
Your Answer is
Correct Answer is D
Explanation
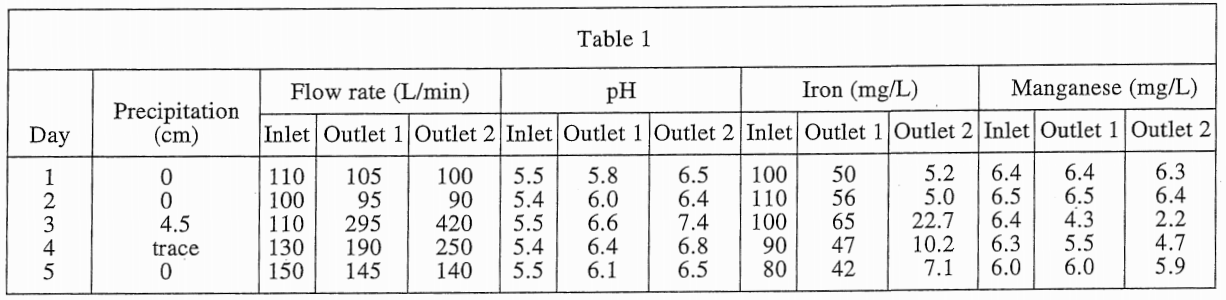
Looking at table 1, the Iron concentration of Outlet 2 is the lowest on Day 2, which is 5.0 mg/L;
It is the highest on Day 3, which is 22.7 mg/L, so it should be option D