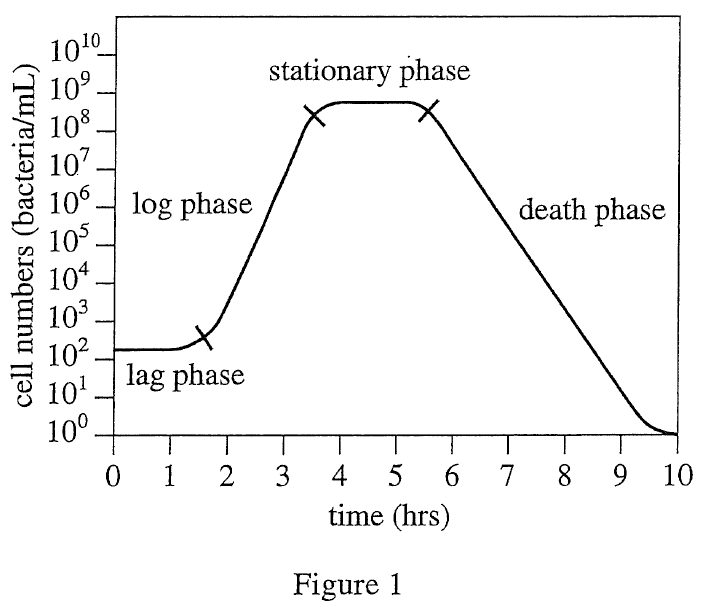
5. Which of the following hypotheses about bacterial populations is supported by the data presented in Figure 1 ?
Answer and Explanation
Your Answer is
Correct Answer is D
Explanation
The method of elimination. First exclude A, because the slope of the line segment is always changing, not change at a constant rate;
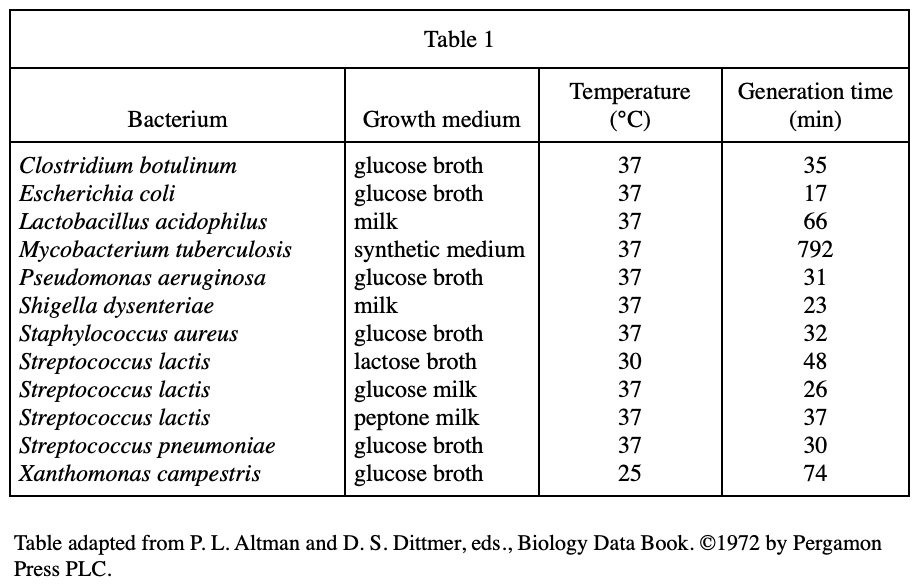
Exclude B, because it can be seen from the generation time in table 1 that it is not immediately;
p>C is also excluded, because it can be seen from figure 1 that there is a lag phase with a constant number first.