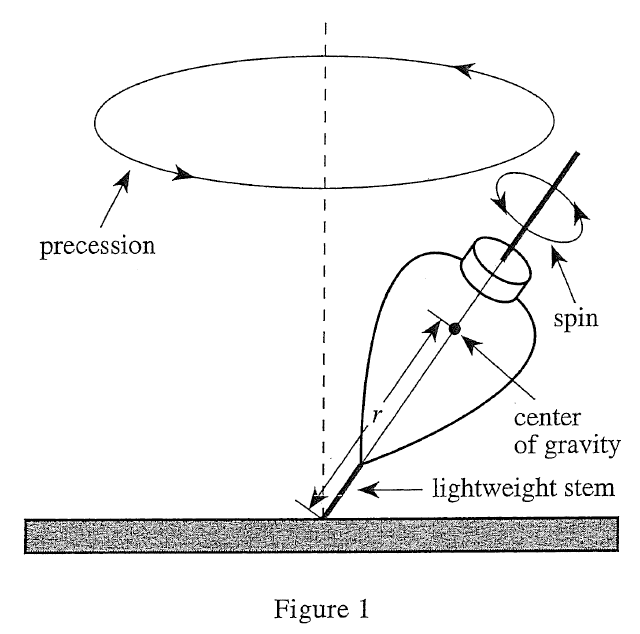
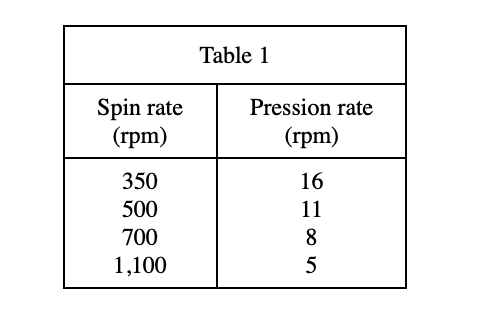
19. Which of the following graphs best represents the with increasing spin rate as change in precession rate shown in Experiment 1 ?
Answer and Explanation
Your Answer is
Correct Answer is C
Explanation
Look at table 1, as the spin rate increases, the compression rate gradually decreases, so it is option C